Download
1 / 64
650 likes | 939 Views
OHIO IMPROVEMENT PROCESS DISTRICT LEADERSHIP TEAM TRAINING. Region 9 November 18 th , 2010 RG Drage Career Tech Center. OIP SYSTEMS TRAINING OUTCOMES. Understand roles and responsibilities of the DLT and BLTs in support of TBTs

E N D
OHIO IMPROVEMENT PROCESS DISTRICT LEADERSHIP TEAM TRAINING Region 9 November 18th, 2010 RG Drage Career Tech Center
OIP SYSTEMS TRAINING OUTCOMES • Understand roles and responsibilities of the DLT and BLTs in support of TBTs • Develop sub-group considerations in data analysis of ALL students • Develop district task list for implementation and practical application for Ohio TBT Six Conditions and 5-Step Process
MORNING TRAINING AGENDA • Welcome and Introductions • Overview of Training Outcomes • Why Teacher Based Teams in Support of ALL Students? • Ohio 5-Step TBT Process Simulation • Simulation Team Reflection Activity LUNCH ON YOUR OWN
AFTERNOON TRAINING AGENDA • District Team Time: Where Do We Go from Here? • Implementation Task Guide (Additional Consideration Questions) • Resource 21: TBT Guide • DLT Roles and Responsibilities in Support of TBTs • BLT Roles and Responsibilities in Support of TBTs • Closing Activities
The main point of school-wide reform is reculturingthe professional community at the school level andtransforming the infrastructure that supports and directs schools. Elmore in Simmons, J. (2006),
Definition of a System• collection of parts integrated to accomplish an overall purpose or goal Purpose of an automobile… Take you from one place to another!
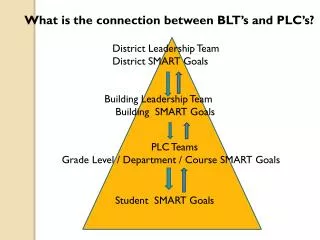
The DLT, BLT, TBT Connection • Collaborative team structures that support a culture of inquiry • Use of data and intentional decision making • Alignment of work to the • district’s goals and strategies • Shared Leadership: supporting ongoing two-way communication and engagement • Job embedded professional development (HQPD)
OIP Collaborative Team “Connections” Discussion Given your district’s OIP framework, discuss the following with your team: • How do the roles and responsibilities of the DLT affect the work of TBTs? 2. How do the roles and responsibilities of BLTs affect the work of the TBTs?
WHY TEACHER BASED TEAMS in SUPPORT OF ALL STUDENTS? • Create shared responsibility for each student as part of “all of our kids” • Eliminate teachers working alone • Provide effective ways for differentiated instruction • Establish ongoing and embedded professional development within the TBT
Settings [schools] resist change because that is one of their functions; they are a source of predictability, coherence, and personal agency when social, economic, and other changes threaten adaptations and survival. Lead and Learning Center from Gallimore et al 2009 Gallimoreet. al 2009
Leadership practices that contribute to better instruction: • Focusing on goals and expectations for student achievement • Creating structures and opportunities for teacher collaboration • Attending to teachers’ professional development needs Lead and Learning Center from Wahlstrom K. L . et. al. 2010
.4 of a standard deviation is considered a moderate gain Robinson et al., 2008 Robinson 2010
.4 of a standard deviation is considered a moderate gain Robinson et al., 2008 Robinson 2010
WHAT WE KNOW ABOUT TBT’S… With a balance of administrative support and pressure, teacher groups are more likely to persist with addressing problems long enough to make a causal connection between instructional decisions and achievement gains. Gallimore et. al 2009
A growing body of evidence suggests that when teachers collaborate to pose and answer questions informed by data from their own students, their knowledge grows and their practice changes. David, J.L., (2008/2009). What the research says about … Collaborative inquiry, Educational Leadership, ASCD, Alexandria, VA
With teachers operating in grade-level teams that meet regularly, the school creates structures for examining student progress, as well as for creating a more coherent curriculum and allowing teachers to learn from one another. Darling-Hammond, L., (2010).
PROTOCOLS ARE CRITICAL for… • Identifying appropriate goals for student learning • Assessing student progress towards the goals • Accessing expertise of colleagues • Planning, preparing, and delivering lessons • Using evidence to evaluate instruction • Reflecting on process Gallimore et. al 2009
Creating a “Culture” of All Students In the Universal Gap Study (Ohio 2009) every district successful in raising and maintaining achievement of Students with Disabilities reported the importance of breaking down barriers in an effort to unify two previously separate cultures into a single, high- impact education for all students.
Are We Closing the Gap? Data from the National Assessment of Educational Progress in 2008 indicated the following about the student performance achievement gap: Students with Disabilities as 27% at Basic level or above; Students without Disabilities as 75% at Basic Level or above. EPE Research Center 2008
Approximately 40% (2.6 million students) of 6.6 million students on IEP’s are classified as LD. Approximately 80% of those students (2.1 million) get the classification because they cannot read. Education Week 9/15/10
Thirteen Categories of Disability How many of the thirteen categories include a cognitive disability?Answer please….. There are 270,000 children in Ohio on an IEP. 83% have average to above average intelligence. Special Ed Leadership Conference – Dr. Shelby
POST-IT NOTE THINK-PAIR-SHARE 1. Individually respond to the following prompt on a post-it note: Considering this information about students with disabilities, what impact might it have on Teacher Based Teams? 2. Choose someone from another district and share your response. 3. Each pair share with another pair.
TEACHER BASED TEAMS By using an inquiry-based team framework, achievement scores rose from the worst to the best in the district. (p. 540) Gallimore et. al 2009
From Doug Reeves… In schools where leadership teams primarily attributed student achievement to STUDENT VARIABLES the average gain between 2005 and 2006 scores on 25 assessments was 6.14% … Reeves 2008
Doug Reeves Yet in schools where the leadership teams primarily attributed student achievement to FACULTY VARIABLES the average gain was 18.4% Reeves 2008
Teacher Implementation related to Student Achievement % Teachers Implementing with Fidelity Student Scores
KEEP IT SIMPLE…FOLLOW THE BASICS • Give a common assessment • Analyze results • Group students by needs • Provide intervention/enrichment • Re-assess, evaluate
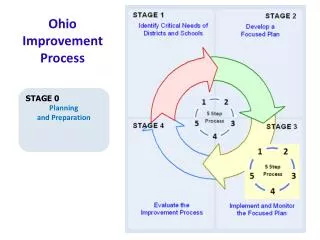
The Ohio 5-Step Process: A Cycle of Inquiry
IMPORTANCE OF COMMON FORMATIVE ASSESSMENTS (CFA) “Schools with the greatest improvements in student achievement consistently used common assessments.” Douglas Reeves, 2004
Step 1 Collect and Chart Student Data from a Common Assessment • CBMs • Teacher Created • End-of-Unit Assessments • Purchased Questions Using HO 2, take 5 minutes to discuss what effective data your TBTs already have that can be used in the Ohio 5-Step Process.
‘ll HO 2 Back
VIDEO CLIP BACKGROUND • Lima Independence Elementary • 4th Grade • Four core teachers, intervention specialist, and building coach • Gave common assessment in math and came prepared to share results
Teacher Based Team Viewing Guide • As you watch the clip, make notes in the first two sections: • Collaboration • Step 1
NOW IT’S YOUR TURN TO PRACTICE THE PROCESS… • Data provided is from a 4th grade Language Arts end of unit assessment • Assessment has a total of 57 questions • Criteria for Grouping • 49 correct and above = Advanced (85% and >) • 40-48 = Benchmarked (70%-85%) • 32-39 = Targeted (55%-69%) • 31 and < = Intensive
SUBGROUPS • This district has asked each building to intentionally monitor the academic progress of their SWDs. The building does not have SWD as an AYP subgroup. • Mark the following students as SWD on your Template: • Seale, Elijah • Pitcher, Cary • Pinkney, Domingo
STEP 2 Analyze student work specific to the data • As you watch the clip, make notes in the Step 2 section.
STEP 3 Establish shared expectations for implementing specific effective changes in the classroom • As you watch the clip, use your Step 3 Template to make notes about the strategies the TBT chooses.
STEP 4 Implement changes consistently across all classrooms
DEBRIEFING STEPS 3-4 • How did they group for instruction? *Note: Last year’s schedule did not have a common intervention time. This year, they do have common intervention time, allowing the students to move and gives more “hands on deck” to reduce group numbers. 2. Whether we agree or not with their instructional choices, what could be learned from this round? 3. How long did they plan to run this cycle? 4. What post test did they choose to use?