Download
1 / 15
180 likes | 436 Views
Sensitivity and Uncertainty Analysis and Optimization in GoldSim. Overview. Uncertainty Analysis Sensitivity Analysis with Monte Carlo simulation Options to support uncertainty and sensitivity analysis when doing Monte Carlo simulation Screening realizations

E N D
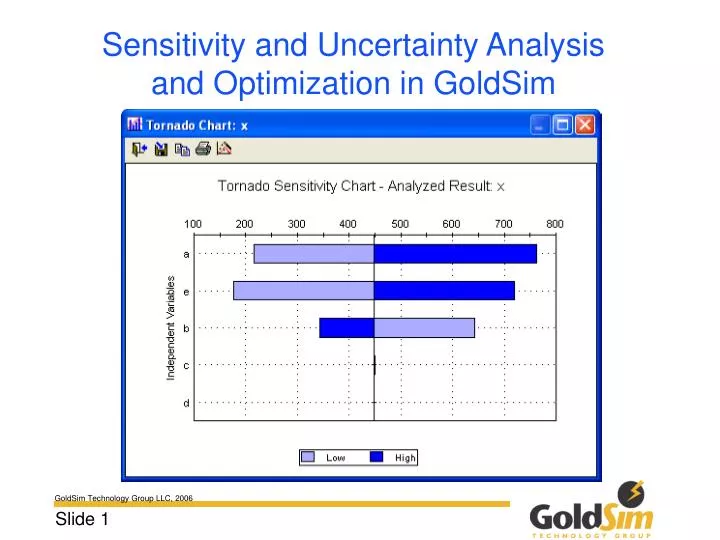
Sensitivity and Uncertainty Analysis and Optimization in GoldSim
Overview • Uncertainty Analysis • Sensitivity Analysis with Monte Carlo simulation • Options to support uncertainty and sensitivity analysis when doing Monte Carlo simulation • Screening realizations • Saving distributions at multiple timepoints • Sensitivity Analysis with deterministic simulations • Optimization
Uncertainty and Sensitivity Analysis • Uncertainty analysis answers the question: • “Which parameters is the uncertainty in the result most sensitive to” • Sensitivity analysis answers the question: • “Which parameters is the result most sensitive to”
Example • A: Uniform(10,20) • B: Uniform(10,20) • C: Uniform(10,20) • E: Uniform(1,5) • D: Constant=10
Uncertainty Analysis in GoldSim • GoldSim computes a correlation matrix • Value (Pearson) correlation indicates a linear relationship • Can capture non-linear relationships with rank (Spearman) correlation
Example • Run 1000 times • For X, select Final Values | Multivariate analysis • Select a Stochastic • Add all stochastics • Variable correlations
Sensitivity Analysis in GoldSim Using Monte Carlo Simulation • Coefficient of determination: This coefficient varies between 0 and 1, and represents the fraction of the total variance in the result that can be explained based on a linear (regression) relationship to the input variables (i.e., Result = aX + bY + cZ + …). The closer this value is to 1, the better that the relationship between the result and the variables can be explained with a linear model. • SRC (Standardized Regression Coefficient): Standardized regression coefficients range between -1 and 1 and provide a normalized measure of the linear relationship between variables and the result. They are the regression coefficients found when all of the variables (and the result) are transformed and expressed in terms of the number of standard deviations away from their mean. GoldSim’s formulation is based on Iman et al (1985).
Sensitivity Analysis in GoldSim Using Monte Carlo Simulation • Partial Correlation Coefficient: Partial correlation coefficients vary between -1 and 1, and reflect the extent to which there is a linear relationship between the selected result and an input variable, after removing the effects of any linear relationships between the other input variables and both the result and the input variable in question. For systems where some of the input variables may be correlated, the partial correlation coefficients represent the “unique” contribution of each input to the result. GoldSim’s formulation is based on Iman et al (1985). • Importance Measure: This measure varies between 0 and 1, and represents the fraction of the result’s variance that is explained by the variable. This measure is useful in identifying nonlinear, non-monotonic relationships between an input variable and the result (which conventional correlation coefficients may not reveal). The importance measure is a normalized version of a measure discussed in Saltelli and Tarantola (2002).
Example • Run 1000 times • For X, select Final Values | Multivariate analysis • Select a Stochastic • Add all stochastics • Sensitivity analysis
Example • Run 1000 times • For X, select Final Values | Multivariate analysis • Select a Stochastic • Add all stochastics • 2D Plot
Sensitivity Analysis in GoldSim Using Deterministic Simulation • Hold all variables at a constant value (typically mean), and then vary each parameter over a specified range • X-Y function charts • Tornado charts • Visually indicates sensitivity
Example • From main menu, select Run | Sensitivity Analysis… • Add all Stochastics • Add D • Select ranges • Carry out analyses
Optimization • Optimize (minimize or maximize) an objective function by: • Adjusting optimization variables • Meeting a Required Condition • Use’s Box’s Complex method to solve
Optimization • Specify Objective Function • Specify Required Condition • Specify Optimization Variables • Example:
Optimization • Common application: calibration • Example: the stock market