Download
1 / 27
290 likes | 464 Views
Uncertainty and Sensitivity Analysis. H. Scott Matthews 12-706 / 19-702. Admin. HW 2 Due Today Please don’t send emails/come by an hour before class and expect answers - from me or TA’s Friday recitation: microeconomics review ** How to distribute @RISK CDs?

E N D
Uncertainty andSensitivity Analysis H. Scott Matthews 12-706 / 19-702
Admin • HW 2 Due Today • Please don’t send emails/come by an hour before class and expect answers - from me or TA’s • Friday recitation: microeconomics review • ** How to distribute @RISK CDs? • All CEE teaching cluster machines being pre-installed.
Problem of Unknown Numbers • If we need a piece of data, we can: • Look it up in a reference source • Collect number through survey/investigation • Guess it ourselves • Get experts to help you guess it • Often only ‘ballpark’, ‘back of the envelope’ or ‘order of magnitude needed • Situations when actual number is unavailable or where rough estimates are good enough • E.g. 100s, 1000s, … (102, 103, etc.) • Source: Mosteller handout
Definitions • Uncertainty: The lack of certainty, A state of having limited knowledge where it is impossible to exactly describe existing state or future outcome(s) (Hubbard 07) • Measuring uncertainty: • Stated by giving a range • Repeated experiments (u = stdev, stderr)
The steps or path • Sensitivity analysis - computing the effect of changes in inputs on model predictions • Uncertainty propagation - calculating the uncertainty in the model outputs induced by input uncertainty • Uncertainty analysis - comparing importance of input uncertainties in terms of their relative contributions to uncertainty in the outputs • (Henrion and Morgan 1990)
Uncertainty • Investment planning and benefit/cost analysis is fraught with uncertainties • forecasts of future are highly uncertain • applications often made to preliminary designs • data is often unavailable • Statistics has confidence intervals – economists need them, too.
Definition: “Base Case” • Generally uses single values and our ‘best guesses’ • Sensitivity Analysis acknowledges uncertainty exists • Incorporate variables instead of constant assumptions • If our ‘Net Benefits’ remain positive over a wide range of reasonable assumptions, then robust results
How many variables? • Choosing ‘variables’ instead of ‘constants’ for all parameters is likely to make model unsolvable • Partial sens. Analysis - change only 1 • Equivalent of dy/dx • Do for the most ‘critical’ assumptions • Can use this to find ‘break-evens’
Best and Worst-Case Analysis • Analogous to “upper and lower bounds” used in estimation problems • Does any combination of inputs reverse the sign of our answer? • If so, are those inputs reasonable? • E.g. using very conservative ests. • Might want NB > 0, but know when NB < 0 • Similar to ‘breakeven analysis’
Recap: Example from Boardman • 3 projects being considered R, F, W • Recreational, forest preserve, wilderness • Which should be selected?
Question 2.4 Project “R with Road” has highest NB
Question 2.4 w/ uncertainty • What if we are told that Benefits/Costs of each project are uncertain by, for example plus or minus 10%? • e.g. instead of Project R having benefits of $10 million, could be as low as $9 million or as high as $11 million • Repeat for all project combinations • Now which project is ‘best’?
Question 2.4 w/ uncertainty Best Case: R w/Road (same) Worst Case: Road Only General Case: Could be several But difficult to determine that from this chart - can we do better?
Using error/uncertainty bars • Show ‘original’ point as well as range of uncertainty associated with point • Range could be fixed number, percentage, standard deviation, other • Excel tutorial available at: • http://phoenix.phys.clemson.edu/tutorials/excel/advgraph.html • See today’s spreadsheet on home page • Graphs original points, and min/max deviations from that as error bars…
Error bar result Net Benefits ($M) • Easier to see results - imagine moving ruler up and down the axis • There is a range from about $3 to $4 million with 3+ options possible
An Easy Visual Clue - Slider Bars • Use built-in excel functions to visually see effects of incremental changes in variables • “Scroll bars” (form toolbar) • Tutorial at: • http://aitt.acadiau.ca/tutorials/Excel97/Sliderbars.htm • Let’s look at our old TV estimation problem • Tool gives easy, visual aid for how sensitive parameters are (but not very quantitative)
Case: Photo-sensors for lighting • Save electricity by installing sensors in areas where natural light exists • Sensors ‘see’ light, only turn light fixtures on when needed • MAIN Posner 2nd floor hallway uses 106 15-watt fluorescent bulbs for 53 fixtures • How could we make a model to determine whether this makes sense? • Assume only one year time frame
Photo-sensors for lighting • Assume we only care about ‘one year project’ • Costs = Labor cost, installation cost, electricity costs, etc. • Assume each bulb costs $6 • Benefits = ? How should we set up model? • Assume equal, set up as ‘show minimum cost’ option • Case 1 ‘Status quo’: assume lights used as is • On all the time, bulbs last 10,000 hours ~ burn out once per year) • Case 2 ‘PS’: pay to install sensors now, bulbs off between 1/3 and 1/2 of time
Lighting Case Study - Status Quo • Costs(SQ) - lights on all the time • Labor cost: cost of replacing used bulbs • “How many CMU facilities employees does it take to change a light bulb?” - and how long does it take? • Assume labor cost = $35/hr, 15 mins/bulb • 26.5 hours to change all bulbs each year, for a total labor cost of $927.50! Also, bulb cost $636/yr • Electricity: 106*15W ~ 14,000 kWh/yr (on 24-7) • Cost varies from 2.5 - 7.5 cents/kWh ~ $350-$1045 • Cost Replacing bulbs is same ‘order of magnitude’ as the electricity! (Total range [$1,911 - $2,608])
Lighting Case Study - PS sensors • Costs(PS) - probably ‘off’ 1/3 - 1/2 of time • Labor cost: cost of installing sensors = ‘unknown’ • Labor cost: cost of installing new bulbs • Could assume 1/2 - 2/3 of bulbs changed per year instead of ‘all of them’ [Total $464 - $700] • Bulbs cost [$318-$424] • Electricity: 106*15W ~ 7,000 kWh/yr @ 1/2 • 9,333 kWh if off 1/3 of the time • Cost varies [ 2.5 - 7.5 cents/kWh] ~ $175-$700 • Total cost (w/o sensors) ~ [$955 - $1,740] • How much should we be WTP for sensors if time horizon is only one year?
PS sensors analysis • WTP [$170 - $1,700] per year (NB>0) • We basically ‘solved for’ benefit • But our main sensitive value was elec. Cost, so range is probably [$919 - $1,129] per yr. • No overlap in ranges - PS always better • Should consider effects over several years • Could do a better bulb replacement model • Use more ranges - Bulb cost, labor, time • Check sensitivity of model answer to changes • Find partial sensitivity results for each • Look at spreadsheet model • This is fairly complicated - easier way?
Sens. Analysis for Photo Sensors • Several built-in options from the plugins @RISK-TopRank [Win only - mac with VPC, Parallels, etc] to check sensitivity. • One-way (one variable at a time) • Tornado and spider diagrams (all at a time) • Two-way (two at a time)
One-Way Sensitivity Analysis • Use plugin. • Makes graph that varies a single variable from a low- to high-end range and shows output (eg NPV) as a function of variable • The resulting graph shows how “sensitive” your answer is to changes in the one variable • Shows simple trend related to one variable
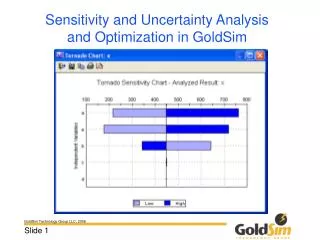
Tornado Diagrams • Shows results of many one-way plots on single chart (one changes while all others held constant) • Length of bars tells you how sensitive output is to each variable • Bigger bar = more sensitive • Software typically “sorts” most to least • Looks like a tornado • Spider diagrams are similar
Plug-in notes • See Clemen pp.193- for TopRank tutorial
Two-way SA • Shows a 2-dimensional plot of what happens when we change 2 variables at once • Graph generated is a “frontier” of feasible options between two variables
EXCEL’s TABLE function • One- and two-input data tables • Sort of a built-in tool for sensitivity analysis (without fancy graphs/etc). • See PDF posted for examples and instructions • TopRank type analysis typically easier, however EXCEL TABLE requires no plug in (or expensive software)