Download
1 / 1
10 likes | 94 Views
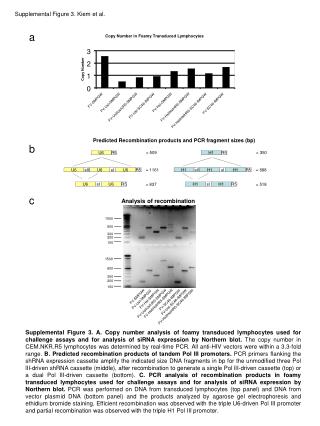
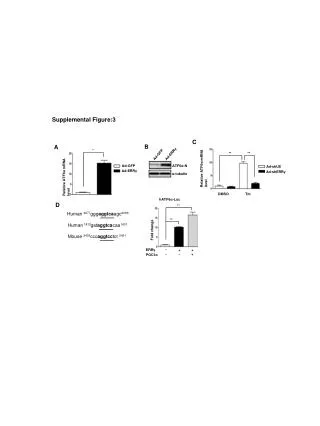
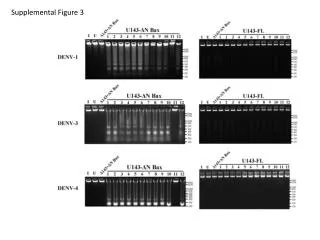
Supplemental Figure 3. Relative expression. Relative expression.

E N D
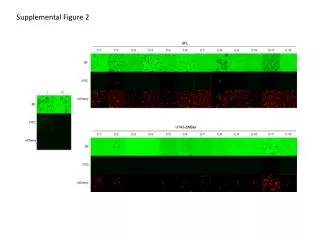
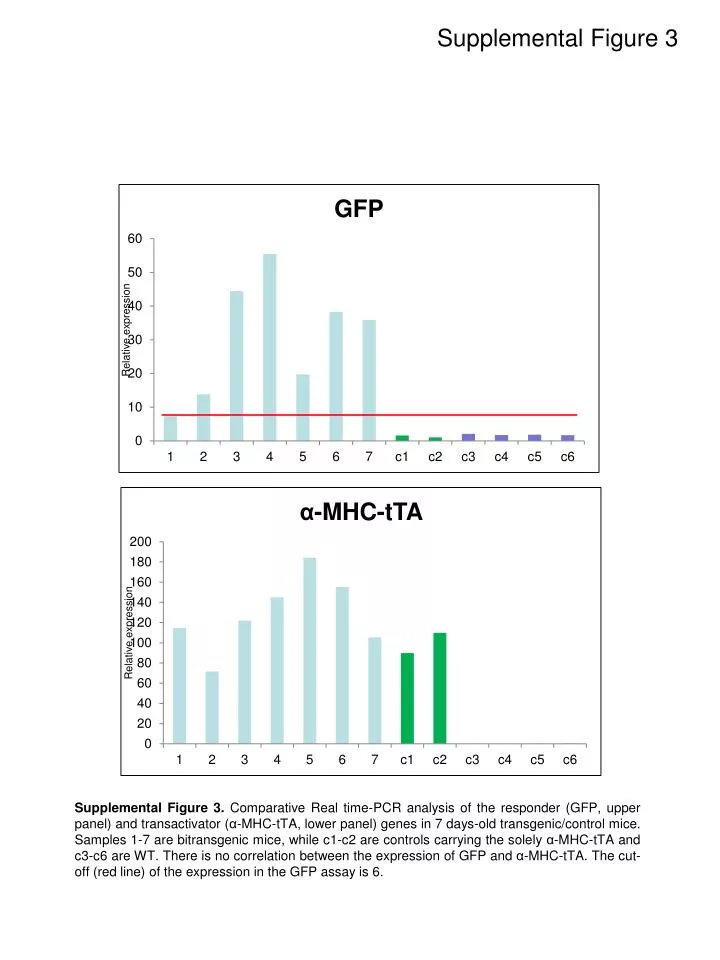
Supplemental Figure 3 Relative expression Relative expression Supplemental Figure 3. ComparativeReal time-PCR analysis of the responder (GFP, upper panel) and transactivator (α-MHC-tTA, lower panel) genes in 7 days-old transgenic/control mice. Samples 1-7 are bitransgenic mice, while c1-c2 are controls carrying the solely α-MHC-tTA and c3-c6 are WT. There is no correlation between the expression of GFP and α-MHC-tTA. The cut-off (red line) of the expression in the GFP assay is 6.