Download
1 / 16
160 likes | 271 Views
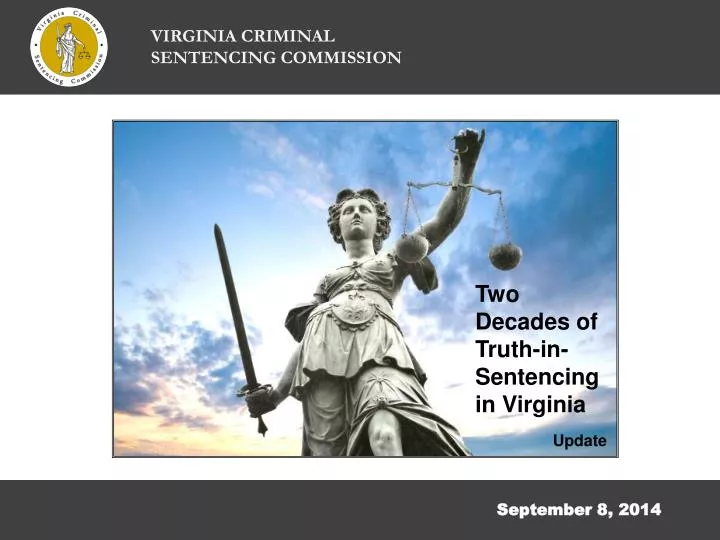
VIRGINIA CRIMINAL SENTENCING COMMISSION. Two Decades of Truth-in-Sentencing in Virginia. September 8, 2014 . Update. Under truth-in-sentencing, felons are serving at least 85% of the sentence ordered by the court. Percentage of Prison Sentence Served. 85%.

E N D
VIRGINIA CRIMINAL SENTENCING COMMISSION Two Decades of Truth-in-Sentencing in Virginia September 8, 2014 Update
Under truth-in-sentencing, felons are serving at least 85% of the sentence ordered by the court. Percentage of Prison Sentence Served 85% Parole system data represent FY1993 prison releases; truth-in-sentencing data is derived from the rate of sentence credits earned among prison inmates as of December 31, 2013
Violent offenders, and particularly repeat violent offenders, are serving longer under truth-in-sentencing. Prison Time Served (in years) Forcible Rape Aggravated Sexual Battery Prior Violent Record Prior Violent Record Robbery with a Firearm Parole System Truth-in-Sentencing These figures present values of actual incarceration time served under parole laws from 1988 through 1992 and expected time to be served under truth-in-sentencing provisions for cases sentenced FY2010 through FY2014. Time served values are represented by the median (the middle value, where half the time served values are higher and half are lower). Truth-in-sentencing data include only cases recommended for, and sentenced to, incarceration of more than six months. Prior Violent Record
Nonviolent offenders are serving about the same amount of time, on average, as they did prior to the abolition of parole. Prison Time Served (in years) Sale of a Schedule I/II Drug Grand Larceny Prior Violent Record Prior Violent Record Parole System Truth-in-Sentencing These figures present values of actual incarceration time served under parole laws from 1988 through 1992 and expected time to be served under truth-in-sentencing provisions for cases sentenced FY2010 through FY2014. Time served values are represented by the median (the middle value, where half the time served values are higher and half are lower). Truth-in-sentencing data include only cases recommended for, and sentenced to, incarceration of more than six months.
In 2009, Virginia ranked tied for 3rd among 34 states examined in terms of longest prison lengths of stay for violent offenders. Time Served in Prison for Violent Offenses in Select States Source: Pew Center on the States, Time Served
In 2009, Virginia ranked tied for 13th among 34 states examined in terms of longest prison lengths of stay for drug offenders. Time Served in Prison for Drug Offenses in Select States Source: Pew Center on the States, Time Served
Using empirical risk assessment, roughly half of the eligible drug, larceny, and fraud offenders are now recommended for alternative sanctions. Risk Assessment for Nonviolent Offenders* Not Recommended for Alternative Recommended for Alternative N=6,358 N=6,627 N=5,620 FY2014 data are not complete * Offenders recommended by the sentencing guidelines for prison or jail incarceration 7
Offenders recommended for alternative sanctions through risk assessment have lower recidivism rates than offenders who are not recommended for such sanctions. Recidivism Rates for Offenders based on Risk Assessment Recommendation Source: Virginia Criminal Sentencing Commission, 2010-2012 Risk Assessment Study
A larger share of Virginia’s prison beds are occupied by violent felons. Virginia Department of Corrections Report on State-Responsible Offender Population Trends: Percent of State Prison Beds Holding Violent Felons* * Identifies inmates who have a current or previous conviction for a violent felony as defined in § 17.1-805 that resulted in a Virginia prison sentence Source: Virginia Department of Corrections, State-Responsible Offender Population Trends
In 2012, Virginia’s violent crime rate was the 4th lowest in the nation and the lowest among southern states. Violent Index Crime Rates, 2012 Virginia Crimes per 100,000 population
In 2012, Virginia’s property crime rate was the 8th lowest in the nation and the lowest among southern states. Property Index Crime Rate, 2012 Virginia Crimes per 100,000 population
Virginia’s crime rate is at a 40-year low, and Virginia’s ranking relative to other states has improved.
Virginia’s overall crime rate has dropped significantly, while its incarceration rate has increased by less than 9%.
Virginia’s prison population growth has slowed. Prison Population Growth
Comparing states that calculate a three-year re-imprisonment rate, Virginia ranks second lowest. Three-Year Re-Imprisonment Rate by State Virginia Note: Missouri’s recidivism rate excludes the release of parole violators who have previously been returned to prison for a violation of supervision within the commitment.