Download
1 / 33
350 likes | 571 Views
SIMPLE PROBABILITY. Probabilities add to 1 Multiply the probability by the number of times. MEAN FROM A TABLE. Multiply frequency by the value Divide this total by total frequency. ESTIMATE OF THE MEAN. 2 extra columns Use mid point of groups Mid point x frequency

E N D
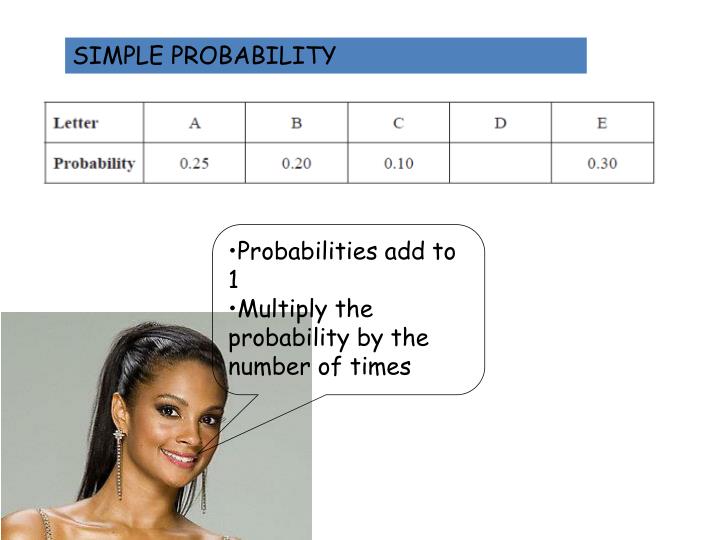
SIMPLE PROBABILITY • Probabilities add to 1 • Multiply the probability by the number of times
MEAN FROM A TABLE • Multiply frequency by the value • Divide this total by total frequency
ESTIMATE OF THE MEAN • 2 extra columns • Use mid point of groups • Mid point x frequency • Big total divided by little total
CUMULATIVE FREQUENCY • Running total • Plot end points against cumulative frequency • Measure median and quartiles
TREE DIAGRAMS • Each V adds to 1 • Multiply alon g the branches
FREQUENCY DIAGRAMS Frequency polygon = join midpoints of bar chart Frequency diagram = bar chart
STANDARD FORM It’s a number between 1 and 10 times by a power of 10. e.g. 450 is 4.5 x 10² Use the exp button on the calculator
POWERS • When multiplying times the numbers and add the powers • When dividing divide the numbers and take away the powers • Power of 0 is 1 • Fraction powers: ½ is square root, 1/3 is cube root
FRACTIONS OF Eg 239 of 100 Total • Fraction of – divide by the bottom, times by the top.
PERCENTAGES • 1% - divide by 100 • 10% - divide by 10 • % change is change / original x 100%
CALCULATOR WORK + ESTIMATION • Work out the top • Work out the bottom • Top divided by the bottom Estimate means round the numbers first
RATIO • RATIO 2:3 MEANS 2+3 = 5 PARTS • FIND THE VALUE OF 1 PART
BEST VALUE Change £ into pence by x 100 Work out the cost of each per unit Show all your working out State the answer at the end
AREA • Rectangle is length x width • Triangle is height x base / 2 • Trapezium is (add parallel sides) x height /2 • Compound shapes – split into easier shapes then add together
VOLUME • Prisms – Area of front x length
ANGLES • Parallel lines- look for FUZ: Corresponding Interior Alternate • Bearings measure clockwise from North
o o xo yo yo xo CIRCLE THEOREM xo xo o a + b = 180° DIAMETER ao x + y = 180° 2xo bo yo Angle made by a diameter is 90°. Angle at centre is twice the angle at the circumference. Opposite angles in a cyclic quadrilateral add up to 180° yo xo RADIUS yo RADIUS xo Alternate segment theorem. Angles subtended by an arc or a chord in the same segment are equal. Angle between a tangent and a radius make 90°
PYTHAGORAS • TAKE THE 2 NUMBERS • SQUARE • SQUARE • ADD OR SUBTRACT • SQUARE ROOT
TRAVEL GRAPH Away from home Journey home Stops Distance Speed Time
ENLARGEMENT Scale factor x3 Count across and up from the centre Times this by 3 from the centre Negative enlargement goes the opposite way
VECTORS • Go from A to B • Only use a and b • -a+bor b-a
TRIG • Right angle triangle • Label sides • Pick correct triangle • Cover up the side you want • If finding angle use the 2ndF button Write SOHCAHTOA on the formula page of the paper
CIRCLES Area = pi x rad2 Circumference = pi x diameter Leave in terms of pi means treat pi as a letter
CONES AND SPHERES Everything you need to know is on the formula sheet on the paper
EXPANDING BRACKETS • Two brackets together – eyebrows and smiley face are 4 multiplies
FACTORISING BRACKETS • Pick the x’s to times together • Pick the numbers to times to the question • Check the smiley face to see if the x term is right
STRAIGHT LINES • Form is y=mx+c • To plot the line, take 3 x values and find out the y values that go with them
STRAIGHT LINES • Look at the gradient – positive or neg • Gradient is up divided by the across • Line is y=mx+c, where m is the gradient and c the intercept
INEQUALITIES 3 included, filled circle -2 not included, empty circle • Integer means whole number • Solve like an equation
FORM AND SOLVE EQUATION • This one is about angles, so add algebra together and put equal to 360. • If perimeter, do the same but put = perimeter. • Solve by simplifying and solving
PLOTTING GRAPHS • Complete table of values • Plot points on grid • Join points together to make a graph
TRANSFORMING GRAPHS Inside the brackets – changes x coords the opposite way Outside the brackets, changes y coords the same way
TYPES OF GRAPHS Quadratic graph y = x2 Cubic graph Y = x3 x2 + y2 = r2 Reciprocal graph Y = 1 / x