Download
1 / 38
380 likes | 541 Views
Air Quality & Economic Development in the San Joaquin Valley. November, 2005. The San Joaquin Valley Air Pollution Challenge. Gap. Framing the Issue. Why care? What is the problem? What is the cause? What is the regulatory scheme?

E N D
Air Quality & Economic Development in the San Joaquin Valley November, 2005
Framing the Issue • Why care? • What is the problem? • What is the cause? • What is the regulatory scheme? • What does all this mean for the Valley? • What are the possible solutions?
Why Care? • high blood pressure • congenital heart defects • asthma and even brain damage Air pollution linked to: • lung cancer • heart attacks • strokes • Who is at risk? • Diabetics • Asthma patients • Those with congenital heart failure • Children playing outdoors are at increased risk The most talented knowledge workers have choices….will they locate their families in high pollution environments?
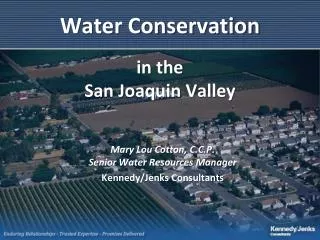
Key Question: How do we accommodate our population and economic growth when we already grossly exceed the SJ Valley’s carrying capacity for pollution? Answer: We must make strategic decisions based on sustainable economic development.
SJ Valley = Growth • Among fastest growing regions in U.S. • 1980 – 2000: • Population = 60% • Daily Vehicle Miles Traveled = 150% • By 2040: • Population = 100% (Total = over 7 million) • Daily Vehicle Miles Traveled = ??
Ozone: SJ Valley v. South Coast • Population & Density • South Coast: 16.0M - 2,450 persons/ sq. mile • SJ Valley: 3.4M - 137 persons/ sq. mile. • South Coast = 18 times greater population density—but pollution levels are essentially the same as the Valley.
Key = SJ Valley’s Low “Carrying Capacity” Why? • Low Dispersion Rates (Mountains → Restrict Air Currents) • Temperature (Daytime Heating + Sunlight Intensity = Perfect for Smog and Ozone) • Thermal Inversions(Occur during evenings and wintertime →concentrate pollutants as the height and volume of the dispersion layer are reduced) • Imported Pollution (From Neighboring Air Basins Trapped in the Valley)
SJV’s Carrying Capacity isOversubscribed SJV: “Non-attainment” under U.S. and CA Law: • Ozone: 1-hr • Ozone: 8-hr • PM10: 24 hour • PM10: annual • PM2.5: 24 hour • PM2.5: Annual
Trends: Federal Standards • 8-hr Ozone: (No material change since 1980) • 24-hr PM 10: • 1990 = 55 days • 2002 = 12 days • 2005 = 0 days since 2002 • 24-hr PM 2.5: ?(Insufficient data to show trend)
Focus: Federal 8-hr Ozone Standard • Since 1999: SJV = Most 8-hr ozone violations in U.S. • Today = “serious non-attainment” • 2007: Plan Due • 2013: Attainment Date (currently projected shortfall:50-80%)
2004 Data is preliminary South Coast 2003 Design Value .131 ppm San Joaquin Valley 2003 Design Value .115 ppm
Air Pollution: Causes • Ozone is a chemical reaction between: • Oxides of Nitrogen (NOx) • Reactive Organic Gases (ROG)
2005 Estimated Annual Average Emissions of Oxides of Nitrogen(2004 Estimated Annual Average Inventory – 2005 Almanac) Mobile Sources 492 Tons NOx/day
2005 Estimated Annual Average Emissions of Reactive Organic Gases(2004 Estimated Annual Average Inventory – 2005 Almanac) Mobile Sources 413 Tons ROG/day Dairy Emissions use the new emission factor.
Trucks: Estimated Average Annual Daily 1998 2020
“On Road Mobile” NOx Sources • Diesel trucks = Most Significant Source • 2 to 4% of “on-road vehicles,” but over 40% of NOx • Approx. 50% of trucks from outside the Valley • 22% last fueled outside CA • 80% of all diesel engines in CA are over 10 yrs old • “Gross Polluters” = A Significant Source • 10% of cars cause more than 50% pollution from light passenger vehicles
What is the Regulatory Scheme? • Federal • Statute: Clean Air Act (CAA) • Agency: Environmental Protection Agency (EPA) • Nat’l engine and fuel standards • State • California Air Resources Board (CARB) • Regional • San Joaquin Valley Air Pollution Control District (SJVAPCD) • Only regulates emissions from stationary sources.
Federal Penalties:Implications for the Valley • Failure to meet CAA: • in billions of federal road dollars • in regulatory requirements • Result? A downward spiral…
Limited CarryingCapacity means more complex policy choices • Should SJV population and economic growth be constrained? • Should H-99 and I-5 as corridors of commerce be constrained? • What areas of economic activity, if any, should be curtailed? • How can we accelerate technology adoption without crippling economic activity? • What is the proper balance between regulation, incentives and assistance? • How do we avoid the unintended consequences?
Comparison of Regional Payroll and Pollution Contribution by Sector(California Employment Development Department and San Joaquin Valley Air Pollution Control District)
Ex: Food Processing Industry • Rule 4306 – “Large Boiler Rule” • Cost of compliance: $78k to $522k per ton NOx/yr • Proposed Rule 4694 – “Wine Fermentation” • Cost of compliance: $120k to $250k per ton NOx/yr • Proposed Rule 4309 – “Dehydrators” • Cost of Compliance: $281k to 562k per ton NOx/yr
Recommendation:A Comprehensive, Integrated Plan • California Partnership for the San Joaquin Valley convene a working group(e.g., SJVAPCD, CARB, the EPA, local government, industry, environmental community and academia). • Develop a comprehensive, integrated plan that includes all stationary and mobile sources • Delegate plan monitoring and coordination to a single agency.
Comprehensive Plan: The Goals • Meet EPA standards and reduce pollution-related health problems to national averages. • 2010 : Significant Objective Progress • 2013: Attainment • Create plan (regulation, incentives and assistance) that considers the Valley’s limited carrying capacity • Achieve sustainable economic development • Involve everyone in the solution • AQ Public education/constituency development
1. Criteria to prioritize emission sources to be addressed? • Clean Air Act compliance • Cost/benefit per ton of pollutants removed • Health Impacts • Impact on jobs. • Proven technology • Timeliness relative to 2013 compliance requirements • Relevance to projected population growth • Relevance to projected economic development goals • Political feasibility • Other?
2. Given these criteria, what are the highest payoff issues to address? Mobile Sources • Gross Polluting Vehicles • North-South goods movement infrastructure • Sprawl • Traffic Synchronization • Truck and bus fleets
2. Given these criteria, what are the highest payoff issues to address? Stationary Sources • Dairies • Non-Dairy ag production • Manufacturing • Other stationary sources • Other?
3. What strategic actions will have highest impact by 2010 – 2013? • Accelerate expansion of H 99 • Accelerate removal of GPV’s (use sensors to identify) • Accelerate replacement/renovation of truck and bus fleets • Flexibility to use grant funds for compliance assistance • Improved rail transportation • Increased regulation of ag & dairy emissions • Indirect Source Rule • Intermodal service facilities • Market-based emissions trading
3. What strategic actions will have highest impact by 2010-2013 (cont’d)? • Modified eligibility criteria for Carl Moyer Program • National Fuel Standards • New mass transit systems • Public education campaign • Regional Land Use and Transportation Authority • Responsibility for coordination and monitoring of SJV Air Quality Plan to a single government entity • Short sea shipping between L.A. and the Bay Area • Urban traffic synchronization • Zoning requirements to encourage walkable communities • Other?
5. What new funding mechanisms should be considered? • Air Quality Empowerment & Enterprise Zone • Alternative use of funds from eliminated smog check program • Emission-based truck toll fees • Federal and State grants for technology & best practices research • Federal and State incentives for clean energy development & use • Goods Movement funding. • Increased funding for Carl Moyer program. • Other?
The San Joaquin ValleyAir Pollution Challenge Comprehensive Plan
Summary of Key Points • The Valley has limited pollution carrying capacity…. ….and a huge challenge to achieve 2013 targets • Deferral is not a good option • Mobile sources are the biggest contributor…. ….but all sources must be addressed • Technology is available….the issue is affordability • A comprehensive plan is required that balances regulation, incentives and assistance…. ...and allows for sustainable economic development • Plan monitoring and coordination responsibility must be assigned to one entity