Download
1 / 14
140 likes | 259 Views
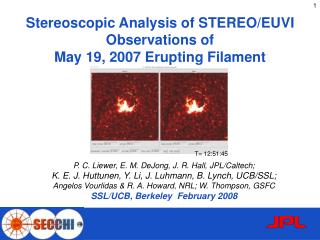
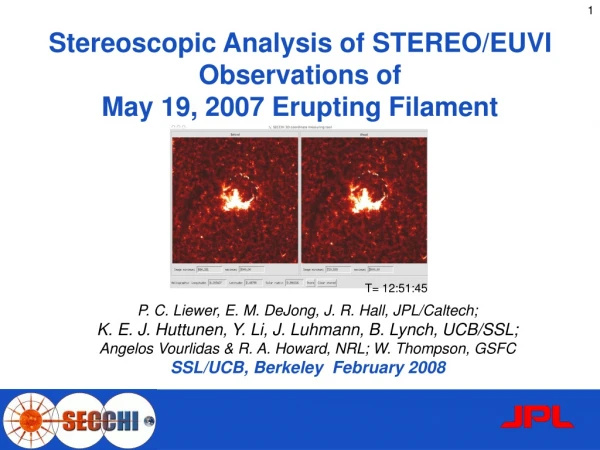
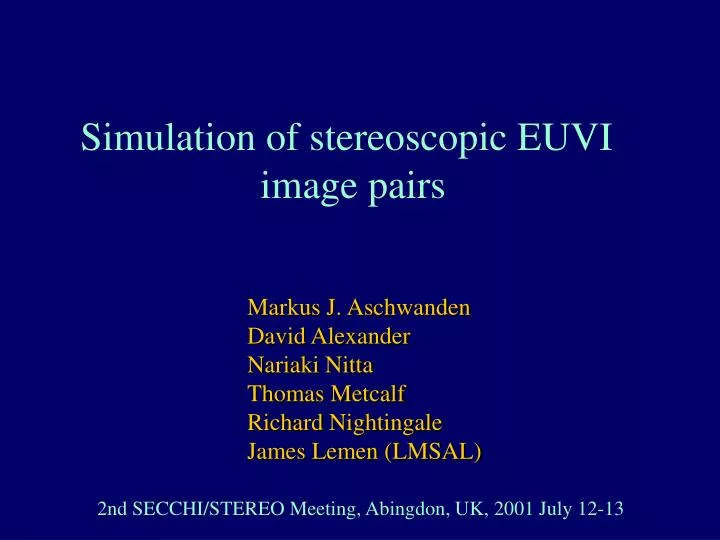
Simulation of stereoscopic EUVI image pairs. Markus J. Aschwanden David Alexander Nariaki Nitta Thomas Metcalf Richard Nightingale James Lemen (LMSAL). 2nd SECCHI/STEREO Meeting, Abingdon, UK, 2001 July 12-13. The Goal.

E N D
Simulation of stereoscopic EUVI image pairs Markus J. Aschwanden David Alexander Nariaki Nitta Thomas Metcalf Richard Nightingale James Lemen (LMSAL) 2nd SECCHI/STEREO Meeting, Abingdon, UK, 2001 July 12-13
The Goal • Create a set of synthetic EUVI image pairs that can be used to test image reconstruction algorithms. • Will make use of two techniques: • Aschwanden method: fit actual TRACE, EIT, and SXT images • Alexander method: start with a Sunspot model to define field lines
Aschwanden algorithm for Stereo Image Pair Creation 1. Select a structure-rich multi-wavelength image from TRACE, EIT, and/or Yohkoh database (with filament, flare, CME, fluxropes, etc.) 2. Trace linear features (loops, filaments, fluxropes) in 2D: s(x,y) 3. Inflate from 2D to 3D with prescription z(x,y) s(x,y) -> s(x,y,z) 4. Physically model structures: T(s), n(s), p(s), EM(s) 5. Geometrically rotate to different stereo angles EM(x,y,z) -> EM(x,y,z) 6. Line-of-sight integration EM(x,y)=EM(x,y,z)dz and convolve with instrumental response function
Step 2: Tracing linear features High-pass filtering Feature tracing, reading coordinates, spline interpolation
s(x,y,z) Step 3: 3D Inflation: z=0 -> z(x,y) - model (e.g. semi-circular loops) - magnetic field extrapolation - curvature minimization in 3D s(x,y)
Step 4: Use physical hydrostatic models of temperature T(s), density n(s), and pressure p(s), to fill geometric structures with plasma
Step 6: Integrate along line-of-sight and convolve with instrumental response function
STEREO - A STEREO - B
Alexander algorithm for Stereo Image Pair Creation • Uses magnetoconvection sunspot model of Hurlburt to define boundary • conditions for field and heating - fully 3D model calculated in wedge. • Field extrapolation into corona assumes potential field at surface. • Heating rate is determined from Poynting flux entering corona. • Poynting flux is a result of interaction of surface flow dynamics with • magnetic field: P=(vxB)xB. • Uniform and footpoint heating sh=10 Mm assumed in simulations. • Fieldlines chosen reflect localized regions for which the Poynting flux is • greater than 90% of maximum value:hence grouping into “fluxtubes”. • 3D volume created, therefore can simulate any viewing angle.
Neal Hurlburt’s Magnetoconvection model for Sunspot
Simulations of TRACE 171 emission Uniform Heating viewpoint Footpoint Heating 3D distribution of coronal field • Base heating rate same 25x higher in • footpoint heating case (not optimized) • Projection yields “fluxtubes” from • “field lines” • Only highly energized loops included: • no background structures
Plans for the Future : - The LMSAL group is planning to produce a set of EUVI stereo pair images : - containing different phenomena (flare, CMEs, filaments) - in different wavelengths (171, 195, 284, 304 A) - from different stereo angles (0, 5, 10, 30, 60, 90 deg) - based on self-consistent hydrostatic models - The EUVI stereo pair images will be distributed to other groups or individuals for general stereoscopic studies, simulations, visualizations, 3D rendering, etc. - Plan to distribute the first set of images at the time of the Dec 2001 AGU meeting