Download
1 / 37
380 likes | 759 Views
Simulation of Steam Flooding at West Coalinga Field. Lekan Fawumi, Scott Brame, and Ron Falta Clemson University School of Environment. Objective. Evaluate the effects of different representations of interwell permeability on steam flood behavior. Outline. Introduction to steam flooding

E N D
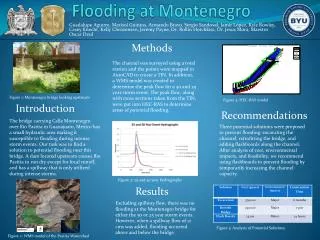
Simulation of Steam Flooding at West Coalinga Field Lekan Fawumi, Scott Brame, and Ron Falta Clemson University School of Environment
Objective • Evaluate the effects of different representations of interwell permeability on steam flood behavior
Outline • Introduction to steam flooding • Numerical simulation of steam flooding • West Coalinga model area and permeability distributions • Steam flood simulations using facies tract, facies group, and facies fractal representations
Steam Flooding in Heavy Oil Reservoirs • The main benefit comes from a large reduction in the oil viscosity with increased temperature • Large pressure gradients also help mobilize oil • Lower interfacial tension and solvent bank effects may also help, but are secondary Viscosity of West Coalinga Crude Oil [Chevron]
Numerical Simulation of Steam Flooding – Physical Processes A field steam flood simulator must include at a minimum: • a mass balance on water and oil • an energy balance • three-phase flow of gas, water, and oil phases • heat transfer by convection and conduction with phase change effects • capability for three-dimensional flow in anisotropic heterogeneous media
PDE for Multiphase Heat Transfer An energy balance gives:
Lawrence Berkeley Laboratory TOUGH2 codes http://www-esd.lbl.gov/TOUGH2/ • Publicly available 3-D multiphase heat and compositional flow codes for heterogeneous porous and fractured systems • Developed over a ~20 year period, originally for geothermal reservoir modeling • Codes are distributed by (with FORTRAN source code) DOE Energy Science and Technology Software Center http://www.osti.gov/estsc/ ; estsc@adonis.osti.gov . The cost to organizations with DOE affiliations is $670, while the cost for private US companies is $2260. • A new graphical users interface (developed with DOE funding) is available from Thunderhead Engineering, Inc.: http://www.thunderheadeng.com/petrasim/
T2VOC version of TOUGH2 • Special version of TOUGH2 developed for environmental steam flood applications [Falta et al., 1995] • Code considers 3 phase flow of 3 mass components: air, water, and an organic chemical (which may be oil) • Full heat transfer and thermodynamics are included • Problem may involve 3-D flow in heterogeneous, anisotropic porous or fractured systems. • A new multicomponent hydrocarbon version called TMVOC was just released by LBNL in May.
Computational effort for steam flood simulation compared to single-phase isothermal flow • Increased number of simultaneous equations -- 3X • Newton-Raphson linearization at each time-step - 5 iterations per time-step -- 5X • Smaller time-steps due to N-R convergence difficulties -- 5-10X • Ill-conditioned, stiff matrices at each N-R iteration of each time-step -- 2-5X • Net result: A steam flood simulation takes at least 150 -500 times more computational effort than a single-phase flow simulation with the same resolution
Steam flood modeling resolution compared to a single-phase flow simulation Single-phase Multiphase Gridblock resolution (same volume) Modeled Volume (same resolution)
Estimated relationship between number of gridblocks and simulation time (2Ghz cpu) 106 5x10⁵ 0 16 cpu 4 cpu Number of gridblocks 1 cpu 0 5 10 Simulation time, days
Standard repeated 5-spot pattern Lines of symmetry injectors producers Basic Element Of symmetry, 1/8 of five spot
P r o d u c t i o n W e l l I n j e c t i o n W e l l 3 0 0 8 0 0 8 - 1 3 0 0 6 0 0 2 3 9 2 2 9 2 3 9 W 2 2 9 W 3 0 0 4 0 0 2 2 8 - 2 B 2 3 8 3 0 0 2 0 0 2 3 8 W 2 2 8 W 2 2 8 3 0 0 0 0 0 2 3 8 A 8 - 2 2 9 9 8 0 0 1 2 8 B 1 2 8 1 1 8 B 2 9 9 6 0 0 Northing 2 3 7 2 2 7 2 9 9 4 0 0 8 - 3 2 3 7 W 2 9 9 2 0 0 1 2 7 1 2 7 B 2 9 9 0 0 0 2 3 6 1 1 8 A 8 - 4 2 9 8 8 0 0 2 3 6 W 0 0 2 9 8 6 1 5 8 7 5 0 0 1 5 8 7 7 0 0 1 5 8 7 9 0 0 1 5 8 8 1 0 0 1 5 8 8 3 0 0 1 5 8 8 5 0 0 E a s t i n g
Well 118A Complete well log showing facies tracts, facies groups, and bounding surfaces. Logs such as this were compared to well 118A to characterize the location of bounding surfaces and facies groups.
Table 2.2 Characteristics of Facies Tracts within the Temblor Formation Table 2.4 Characteristics of the facies Groups from Bridges (2001). 63 Uni t Facies Tract Lithology Grain Size Sorting Mean Permeability (mD) 1 Incised Valley Basal conglomerate, fining upward to cross-bedded sand, silt, and clay Very fine to coarse, minor cobbles, pebbles, silt and clay Very poor to good 562 2 Estuarine Interlaminated sand, silt, and clay, burrowed clay intervals, sandy clay intervals Fine to medium Moderate 316 3 Tide-to Wave-dominated shoreline Crossbedded sand with burrowed sand and clay; fossiliferous sand Medium to coarse sand , minor pebbles, very fine to fine sand, silt and clay Poor to good 316 4 Diatomite Clay, silt, and fine sand Fine sand and clay Good 22 5 Subtidal Massive burrowed sand, thin intervals of silt and clay; rare fossiliferous sand Sand, silt, and clay Poor to good 224 Facies Tracts Used in Model
Well 118A Complete well log showing facies tracts, facies groups, and bounding surfaces. Logs such as this were compared to well 118A to characterize the location of bounding surfaces and facies groups.
Table 2.4 Characteristics of the facies Groups from Bridges (2001). Facies Group Facies Present Permeability Range Mean Permeability Group 1 Clean sand, cross-bedded sand, pebbly sand 1500 md to 8000 md 3180 md Group 2 Interlaminated sand and clay, Silt, Sandy clay, Clay 75 md to 3000 md 500 md Group 3 Burrowed clayey sand, Burrowed Interlaminated Sand and Clay, Burrowed Sandy Clay, Burrowed Clay 5 md to 800 md 255 md Group 4 Bioturbated Sand, Carbonate Cemented Zones 50 md to 1000 md 525 md Group 5 Fossiliferous Sand Zero to 600 md 225 md Facies Groups Used in Model
Facies Fractal Model • A 3-D fractal distributions of k are generated using the properties of each facies group on a fine grid • Based on the location in the coarser simulation grid, the facies group type is known, so the appropriate fractal k values are extracted, preserving the facies group structure in the model • The fine grid fractal k values are upscaled to the simulation grid using an arithmetic mean for the horizontal permeability, and a harmonic mean for the vertical permeability. This upscaling can have a large effect on the final k values used in the simulation!
Comments on water phase relative permeability and initial oil saturaton • Our choice of the water phase relative permeability curve was based on a fit of data from a core from Chevron • The initial oil saturation in the model was interpolated from Chevron values derived from the well logs • HOWEVER – these values resulted in simulations where the water to oil ratio was off by a factor of 10 or more compared to field values! • To better match the field values, we reduced the water relative permeability endpoint from .56 to .15, and • We increased the oil saturations everywhere by 20% (with an upper limit of 70% oil)
Conclusions • The three permeability representations predict similar oil and water production from the field. The facies group model arguably provided the best match of the oil production rate • Only a single realization of the facies fractal model was simulated. A Monte Carlo simulation approach would be needed to see the true effect of the facies fractal permeability representation • Upscaling the fine grid fractal values to the simulation grid scale presents some important and unresolved issues. This could be a useful area for future theoretical research • The over-prediction of water rates may be due to the choice of boundary conditions. • The rate of water production is sensitive to the shape of the water relative permeability curve. The applicability of measured core values in field scale simulation seems questionable.