Download

1 / 52
520 likes | 738 Views
Demography of Russia and the Former Soviet Union . Lecture 13 Sociology SOCI 20182. Schedule of student presentations. Monday, February 22 No lectures, to give students more time to prepare their presentations

E N D
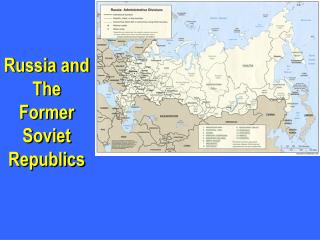
Demography of Russia and the Former Soviet Union Lecture 13 Sociology SOCI 20182
Schedule of student presentations • Monday, February 22 No lectures, to give students more time to prepare their presentations • Wednesday, February 24 No lectures, to give students more time to prepare their presentations
Schedule of student presentations • Monday, March 1 Student presentations: • 1. Armenia, (Danny Fittante) • 2. Belarus, (Neil Sobin) • 3. Latvia, (Roman Sanders) • 4. Estonia, (Rebecca Plummer)
Schedule of student presentations • Wednesday, March 3 Student presentations: • 1. Georgia, (Erin Pappas) • 2. Azerbaijan, (Iliya Gutin) • 3. Uzbekistan, (Ross Smeltzer) • Discussion (if time permits)
Student presentations • Overall description of the country (geographic position, population structure, natural increase/decrease) • Trends in fertility and family formation after the independence • Trends in mortality after the independence • Population aging • Migration • Similarities and dissimilarities with Russia • List of sources used (data sources and publications) • Duration: 15 min (15-20 slides) • If you cannot find information about all topics listed above, please use data that you are able to find.
Based on the Study of Ethnic Differentials in Adult Mortality in Central Asia Michel Guillot (PI), University of Wisconsin-Madison Natalia Gavrilova, University of Chicago Tetyana Pudrovska, University of Wisconsin-Madison
Background on Kyrgyzstan • Former Soviet republic; became independent in 1991 • Population: 5.2 million (2006) • Experienced a severe economic depression after break-up of Soviet Union • GNI per capita = 440 USD; 28th poorest country in the world (2005) • 48% of population below national poverty line (2001)
Ethnic Groups in Kyrgyzstan • Native Central Asian groups: Kazakh, Kyrgyz, Tajik, Turkmen, Uzbek (Sunni Muslims) • Slavs: Russian, Ukrainian, Bielorussian • Kyrgyzstan, 1999 census: • Central Asians: 79% of pop. (Kyrgyz 65%) • Slavs: 14% of pop. (Russian 12%)
Mortality paradox? • Soviet period: Russians/Slavs occupied dominant positions in the socio-economic structure of Central Asian societies (Kahn 1993)
Mortality paradox? • Slavic females more educated than Central Asian females (1989 and 1999 censuses) • Slavic males: educational advantage not so clear – varies by age (1989 and 1999 censuses) • Slavic households less poor than Central Asians (1993 World Bank poverty survey) • Infant mortality lower among Slavs (Soviet and post-Soviet period)
Proportion of individuals with post-secondary education, by age and ethnicity, in 1989 census. Females
Mortality paradox? • Slavic females more educated than Central Asian females (1989 and 1999 censuses) • Slavic males: educational advantage not so clear – varies by age (1989 and 1999 censuses) • Slavic households less poor than Central Asians (1993 World Bank poverty survey) • Infant mortality lower among Slavs (Soviet and post-Soviet period)
Proportion of individuals with post-secondary education, by age and ethnicity, in 1989 census. Males.
Mortality paradox? • Slavic females more educated than Central Asian females (1989 and 1999 censuses) • Slavic males: educational advantage not so clear – varies by age (1989 and 1999 censuses) • Slavic households less poor than Central Asians (1993 World Bank poverty survey) • Infant mortality lower among Slavs (Soviet and post-Soviet period)
Mortality paradox? • Slavic females more educated than Central Asian females (1989 and 1999 censuses) • Slavic males: educational advantage not so clear – varies by age (1989 and 1999 censuses) • Slavic households less poor than Central Asians (1993 World Bank poverty survey) • Infant mortality lower among Slavs (Soviet and post-Soviet period)
Data • Unpublished population and death tabulations since 1959 • collected from local archives • Individual census records – 1999 • Individual death records – 1998-1999 • obtained from national statistical office
Possible explanations for mortality paradox • Data artifacts • Migration effects (esp. 1989-99) • Cultural effects
Data artifacts? • Could the lower recorded mortality among Central Asian adults be due to lower data quality among them (coverage of deaths, age misreporting)?
Migration effects? • 1/3 of Russian population has left Kyrgyzstan since 1991 • Could the increased disparity between Russian and Kyrgyz adult mortality be due to selective migration (healthy migrant effect)?
Cultural effects? • Culture may affect mortality in various ways: • individual health and lifestyle behaviors (e.g., diet, smoking, alcohol, use of preventive care) • family structure and social networks (denser social networks may produce lower stress levels and better health) • Could different cultural practices among Slavs and Central Asians explain the observed mortality differentials?
Data artifacts? • Intercensal estimates of death registration coverage above age 60 (Guillot, 2004): • 90+ % as early as 1959 in urban areas • coverage in rural areas was low initially (~50%) but caught up with urban areas in 1980s • Total population: 92% for 1989-99 period • Adult deaths (20-59) usually better reported than deaths 60+
Cohort-specific changes in educational attainment, Males, 1989-99
Cohort-specific changes in educational attainment, Females, 1989-99
Cultural effects? • Analysis of causes of death by ethnicity, 1998-99 • Calculations based on micro-data • Deaths: vital registration (1998-99) • Exposure: census (March 1999) • Ages 20-59 • Ethnicity: Central Asians vs. Slavs • ~20,000 death records; ~2.2 million census records
Age-standardized Death Rates at working ages (per 100000), 1998-99, by cause and ethnicity, Males
Contribution of causes of death to the difference in life expectancy at working ages (40e20) between Slavs and Central Asians Males (total difference = 2.90 years)
Age-standardized Death Rates at working ages (per 100,000). Detailed Injuries, Males
Age-standardized Death Rates at working ages (per 100,000), 1998-99, by cause and ethnicity, Females
Contribution of causes of death to the difference in life expectancy at working ages (40e20) between Slavs and Central Asians Females (total difference = .28 years)
Age-standardized Death Rates at working ages (per 100,000) Detailed Injuries, Females
Alcohol-related Causes of Death(Chronic alcoholism, Alcohol psychoses, Alcohol cirrhosis of the liver, Accidental poisoning by alcohol) Age-standardized Death Rates at working ages (per 100,000)
Multivariate analysis • Do ethnic mortality differentials at adult ages remain once we account for differences in education and urban/rural residence? • Negative binomial regression • Dependent variable: deaths from all causes; deaths by major cause (7) • Explanatory variables: exposure, dummy variables for age, ethnicity, urban/rural residence, education (3 cat.) • Males and Females analyzed separately • Model 1: age, ethnicity • Model 2: age, ethnicity, education, residence
Risk Ratio Slavs/CAFemales NS NS NS NS NS NS NS NS
Conclusions • Excess mortality among adult Slavs (Soviet and post-Soviet period) is not likely due to data artifacts or migration effects • Excess mortality due to important ethnic differences in cause-specific mortality – alcohol and suicide in particular • Differences remain unexplained by education or residence
Conclusions • Role of cultural characteristics? • Alcohol tied to cultural practices (“culture of alcohol” among Russians; Impact of Islam for Central Asians) • Denser social networks and stronger social support among Central Asian ethnic groups?
Fertility by birth cohort and ethnicity Based on census data
Ethnic differences in demographic transition • For Russian women demographic transition started early • Generations of Kyrgyz and Uzbek women born in the 1930s and 1940s have the highest fertility • Fertility of Kyrgyz and Uzbek women started to decline among postwar and later generations