Download
1 / 67
680 likes | 1.13k Views
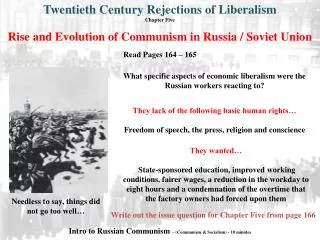
Demography of Russia and the Former Soviet Union . Lecture 6 Sociology SOCI 20182. New Information about the Schedule of Censuses in CIS. 2009 – Kazakhstan, Kyrgyzstan, Belarus, Azerbaijan 2010 – Russia, Tajikistan 2011 – Armenia, Ukraine 2012 – Turkmenistan ? - Uzbekistan, Moldova.

E N D
Demography of Russia and the Former Soviet Union Lecture 6 Sociology SOCI 20182
New Information about the Schedule of Censuses in CIS • 2009 – Kazakhstan, Kyrgyzstan, Belarus, Azerbaijan • 2010 – Russia, Tajikistan • 2011 – Armenia, Ukraine • 2012 – Turkmenistan • ? - Uzbekistan, Moldova
Fertility measures • Crude Birth Rate, CBR • General Fertility Rate, GFR • Age-specific Fertility Rates, ASFR or Age-specific Birth Rates, ASBR • Marital Fertility Rate, MFR • Total Fertility Rate, TFR (period and cohort) • Gross Reproduction Rate, GRR • Net Reproduction Rate, NRR • Parity Progression Ratios, PPR
Crude Birth Rate, CBR • Number of births in the studied year divided by average size of the population during the year, per 1,000 persons: • Easy to calculate but depends not only on individual-level childbearing behavior, but also on age and sex distribution of population.
Total Fertility Rate, TFR Period total fertility rate, PTFR • The average number of children a women would bear in her life if she experiences the age-specific fertility rates prevailing at the study period. • Total Fertility Rate, TFR, for a given year is calculated by summing the age-specific fertility rates for that year over the range of reproductive ages.
Net Reproduction Rate, NRR (period) • The average number of DAUGHTERS a women would bear in her life if she experiences the age-specific fertility rates (for daughters) prevailing at the study period, AND if her daughters experienced the prevailing rates of mortality. • Takes into account both fertility and survival but difficult to calculate (detailed data required). All problems of period indicator (not applicable to real cohorts)
Existing explanations of fertility drop during the 1990s • Economic crisis (uncertainty about the future and increasing the costs of child rearing) • Socio-cultural change (transition towards more western practices of family formation and childbearing) • Soviet pronatalist policies in the early 1980s (benefits for women giving birth to the 3rd child, 3-year paid maternity leave) – accelerated births which otherwise would happen later
Distribution of Russian households by number of children below age 18 in 2002
Families with many children in Russia • Only 6.6% of families in Russia have more than 3 children • Proportion of families with 3 and more children differs from 53% in Ingushetiya to 1% in St-Peterburg • Families with 3 and more children are the poorest compared to families with less children and have poor housing conditions • However self-rated health of children in these families does not differ from families with less children
New Survey in Russia • Two waves of demographic survey “Parents and children, men and women in family and society” as a part of international scientific program “Generations and Gender.” • First wave was conducted in 2004 and had 11,261 respondents. • Second wave took place in 2007 and had 11,117 respondents • Panel component – 7,786 respondents aged 21-82 years.
Effect of income on fertility (number of children per woman) Higher income Lower income
Other factors of fertility (between two survey waves) • Having a partner (formal marriage status not important) • Previous children– probability of the second child was almost twice as lower and probability of the third and other child almost 7 times as lower compared to the first child • Rural residence (fertility in rural areas 1.4 times higher than in urban areas) • Maternal age – fertility is obviously higher among younger women (<35 years) • Effect of education and employment status is not strong
Factors of fertility decline (in %) between 1989 and 1999 in Kyrgyzstan Decomposition using method of Bongaarts and Potter (1983)
Marriage • Marriage is a legal contract between two individuals to form a sexual, productive, and reproductive union • Important characteristics of marriage: permanence, joint production, coresidence, and the social recognition of a sexual and childbearing union (Waite, Gallagher)
Measures of marriage • Crude marriage rate – number of marriages per 1000 population • Pros: Easy to calculate • Cons: Is affected by population structure (proportion of birth cohorts at young adult ages)
Crude marriage rates (per 1000 population) in Russia, USA, and Estonia
Russia: Recent trends in marriage • In 2001-2005 marriage rates increased (in 2005 crude marriage rate – 7.5 per 1000 - returned to its levels of early 1990s) • The number of first marriages grew faster than the number of marriages of other orders (by 29.5% for men and 30.2% for women during 1998-2005) • However the proportion of second and higher order marriages now (24-28% of all marriages) is 10% higher than 20 years ago
Regional distribution of marriage rates per 1000 population in Russia, 1999
Total first marriage rate (TFMR) • Total first marriage rate — the probability of first marriage for a person if he/she passed through ages 15–49 conforming to the age-specific first marriage rates of a given year; refers to a synthetic cohort. It is calculated as the sum of the age-specific first marriage rates observed in a given year. • The indicator can exceed 1 in the years of rapid increase in the number of marriages, although it is excluded that a person can contract more than one first marriage. • Indicates popularity of marriage
Regional distribution of divorce rates per 1000 population in Russia, 1999
Degradation of divorce statistics after 1999 • Legislation of 1999 – after the court decision former husband and wife were allowed to take their divorce certificates in any local branch of ZAGS rather than in the ZAGS where their marriage was registered • Result: double counting of divorces • Attempted to correct in 2003 • Increasing number of divorced with unknown age
Age-specific divorce rates (per married population) in Kyrgyzstan • Solid line 1999 • Dotted line 1989 • Blue- men • Red - women
Kyrgyzstan: Marriage did not become more stable • In the 1990s the decline in divorces was slower than decline in marriages • Marriage rate decline by 45% and divorce rate declined by 34% • So the ratio of total divorce rate to total marriage rate increased from 0.22 to 0.27. That is, for 100 marriages there were 27 divorces in 1999 compared to 22 divorces in 1989 (calculated for synthetic cohort)
Family in Russia before the bolshevik revolution • Patriarchal family, many children • Marriages are registered by church
Marriages in Russia, legislation Bolsheviks introduced civil marriages as the only recognized union The Code of 16 September, 1918: • Fixed age of women at 16 years and men at 18 years • Equality of spouses • Equal rights of children born in marriage and outside of marriage
Family in the USSR • Soviet court
The Code of USSR Republics adopted in 1926 Facilitated divorces (only one spouse could request divorce, the other spouse being informed by mail – ‘divorce by postcard’) Recognized ‘de facto’ marriages (not officially registered) It was the most liberal marriage legislation in Russian history
Woman in the Soviet Union • Had equal rights with men • Including the right for labor • Soviet poster encourages women to fight outdated rules and customs of the past
Women in the Soviet Union • Had equal rights with men in all regards Could elect and be elected
Women Who Report Having Suffered Physical Abuse by a Spouse or Partner (survey in 1993-2001) Note: Data for Russia cover three urban areas only. All data represent lifetime experiences of abuse.
Tightening of legislation after 1936 • The Decree of 27 June 1936 – made divorce costly (first resulted in 65% fall of the number of divorces) • The Decree of 1941 “On taxes on unmarried, single and childless citizens of the USSR” • The Decree of 1944: cancelled the recognition of de facto unions (triggered off the wave of marriages)
Liberalization of legislation after death of Stalin • 1954 – marriages with foreign citizens allowed • 1955 – abortion was once again permitted • 1957 – the tax on the single was annulled • 1966 – the divorce procedure was simplified (in 1966-1967 the number of divorces almost doubled)
Proportion of remarriages per 100 marriages (all orders), Russia
Marriage in traditional societies • Sexual, matrimonial and reproductive behaviors are tightly bound Marriage in modern societies • Sexual, matrimonial and reproductive behaviors are not strongly related • Russia and other FSU countries are at the beginning of transition to the modern type of family
New trends in union formation and fertility in Russia • Increasing age at first marriage • Growing proportion of cohabitation at younger ages • Rapid decline of fertility at very young ages • Postponement of first births in real birth cohorts • Decline of abortions and simultaneous decline of births before age 25 • Increasing contribution of older mothers into total fertility • Decreasing number of marriages stimulated by pre-marital conceptions
Current trends in marriage • Young men do not rush to marry even in the case of unexpected pregnancy of female partner • Young women tend to marry men with resources • As a result, increase in the mean age at marriage particularly for men (by 2.5 years for men and 1.9 years for women from 1993 to 2005) • Decrease in the number of births at very young ages • Increase in the mean difference between husband and wife ages (from 2 years to 2.8 years)
Increasing proportion of cohabitation • Proportion of unregistered unions increased from 11.4% in 1994 to 32.6% in 2002 for age group 18-19 years • In the age group 20-24 years this proportion increased from 6.7% in 1994 to 19% in 2002 • Similar trends for older age groups • Demographers called it “silent revolution” in marriage
Rapid decline of fertility at very young agesAge-specific fertility at different ages