Download
1 / 33
330 likes | 449 Views
Predicting Exchange Rates Out of Sample: Can Economic Fundamentals Beat the Random Walk ? . Jiahan Li Assistant professor of Statistics University of Notre Dame Joint work with Wei Wang and Ilias Tsiakas R/Finance 2013. Asset price and economic Fundamentals . Asset Prices.

E N D
Predicting Exchange Rates Out of Sample: • Can Economic Fundamentals Beat the Random Walk? Jiahan Li • Assistant professor of Statistics • University of Notre Dame Joint work with Wei Wang and IliasTsiakas • R/Finance 2013
Asset price and economic Fundamentals Asset Prices Economic Fundamentals Photo: http://oneinabillionblog.com/tag/green-economy/
Bond price and Economic Fundamentals Mönch, E. (2008). Forecasting the yield curve in a data-rich environment: A no-arbitrage factor-augmented VAR approach. Journal of Econometrics, 146(1), 26-43. Economic fundamentals can predict yield curve. Economic fundamentals: more than 100 economic indicators, including industrial production, CPI, money supply, employment rate, … Method: No-arbitrage restrictions PCA VAR
Stock price and Economic Fundamentals Rapach, D. E., Strauss, J. K., & Zhou, G. (2010). Out-of-sample equity premium prediction: Combination forecasts and links to the real economy. Review of Financial Studies, 23(2), 821-862. Economic fundamentals can predict S&P500. Economic fundamentals: short-term yield, long-term yield, term spread, default spread, inflation, consumption/wealth, … Method: combined forecasts.
Combined forecasts K predictive models give K forecasts. Option 1 (simple combination): take the mean, median, or trimmed mean Option 2: take their weighted average, with the weights being determined by the past performance of individual models, or Discounted Mean Squared Error (DMSE). Benchmark: historical average (random model) by Campbell and Thompson, RFS, 2007.
Rapach, Strauss, and Zhou(2010) DMSE: This forecasts combination is based on individual models’ past performance, measured by Discounted Mean Squared Error (DMSE). θ is the discounting factor. Benchmark: random walk
Whether economic fundamentals can predict other asset prices? Look abroad (Photo: Guy Parsons)
Foreign exchange rates and Economic Fundamentals - Outline Economic fundamentals Forecasting method: Individual models “Kitchen-sink” model Combined forecasts Efficient “kitchen-sink” model Predictability evaluation: Statistical predictability Portfolio returns
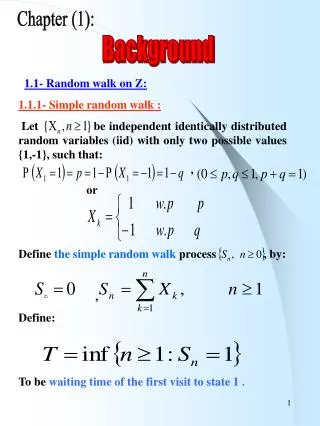
Economic fundamentals Random Walk (RW): xt = 0 rt+1 = α + et+1 t+1 = = historical average
Economic fundamentals Random Walk (RW): xt = 0 Uncovered Interest Parity (UIP): xt= x1t = Δ (interest rate)t The difference in interest rates between two countries is equal to the expected change in exchange rates between the countries' currencies. Otherwise, arbitrage opportunityexists. Most studies indicate the violation of this condition. Carry trade strategy.
Economic fundamentals Random Walk (RW): xt = 0 Uncovered Interest Parity (UIP): xt= x1t = Δ (interest rate)t Purchasing Power Parity (PPP): xt= x2t = Δ (price level)t – st law of one price. identical goods will have the same price in different markets.
Economic fundamentals Random Walk (RW): xt = 0 Uncovered Interest Parity (UIP): xt= x1t = Δ (interest rate)t Purchasing Power Parity (PPP): xt= x2t = Δ (price level)t – st Monetary Fundamentals (MF): xt= x3t = Δ (money supply)t – Δ (national income)t – st Taylor Rule (TR): xt= x4t = 1.5 Δ (inflation)t +0.1 Δ (output gap)t – 0.1 Δ (price level)t – 0.1st
Model, Return and Econ Fundamentals Pt : nominal exchange rate (domestic price of 1 foreign currency unit) rt+1= log(Pt+1) - log(Pt)is the foreign exchange rate return Different models have different predictor, xt, in the predictive regression rt+1 = α + βxt + et+1 Economic fundamentals: xt
Foreign exchange rates and Economic Fundamentals - method Individual models: rt+1 = α + βxt + et+1 “Kitchen sink” regression: include x1t, x2t , x3t , x4t in a multiple regression Combined forecasts: generate forecasts from individual models. Simple combined forecasts: take the mean, median, or trimmed mean Take their weighted average, with the weights are determined by the past performance of individual models (DMSE).
Data • Monthly FX data ranging from January 1976 to June 2012 (~ 35 years). • The 10 most liquid (G10) currencies in the world: • 9 exchange rates. • Japanese yen • Norwegian kroner • New Zealand dollar • Swedish kronor • US dollar • Australian dollar • Canadian dollar • Swiss franc • Deutsche mark • British pound
Out-of-sample forecasts Estimation window Out-of-sample evaluation period Jan 1976 Jan 1986 Jun 2012 • The first FX return to be predicted is in January 1986 (using a 10 year estimation window) • Keep updating estimation window.
Statistical evaluation • Out-of-sample R2 • is the model’s forecast, is the benchmark’s forecast (historical average). • Positive out-of-sample R2 • the lower alternative model’s error • the better the alternative model
Economic evaluation • Mean-variance strategy • Mean-variance strategy: target volatility (annualized) = 10% • Covariance estimates: sample covariance • We also implement 1/N strategy and momentum strategy
“Efficient kitchen-sink” model What is the problem with “kitchen-sink” model? More information leads to bad forecasts ?? Let’s examine in the predictive regression of each currency
“Efficient kitchen-sink” model What is the problem with “kitchen-sink” model? are inflated. This motivates shrinkage estimation.
“Efficient kitchen-sink” model Constraint least squares that minimizes subject to constraints: and This is the elastic-net regression. Consequence: The estimated regression coefficients () are shrunk towards 0.
“Efficient kitchen-sink” model More robust and stable compared to traditional ones Forecasting error-oriented procedure Linear model – consistent with many empirical models in economics and finance
Cumulative Wealth: what if you invested $1 in January 1976 ?
Cumulative Wealth: what if you invested $1 in January 1976 ?
Take-home message.. It’s all about how to process information. Traditional regression is in-sample explanatory power-oriented, not forecasting-oriented. Remedies: forecasts combinations; shrinkage estimation R package: lars, elasticnet, glmnet, grpreg