Download
1 / 45
450 likes | 540 Views
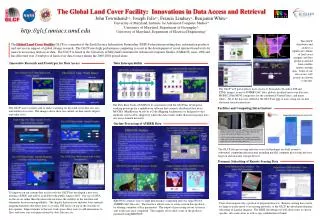
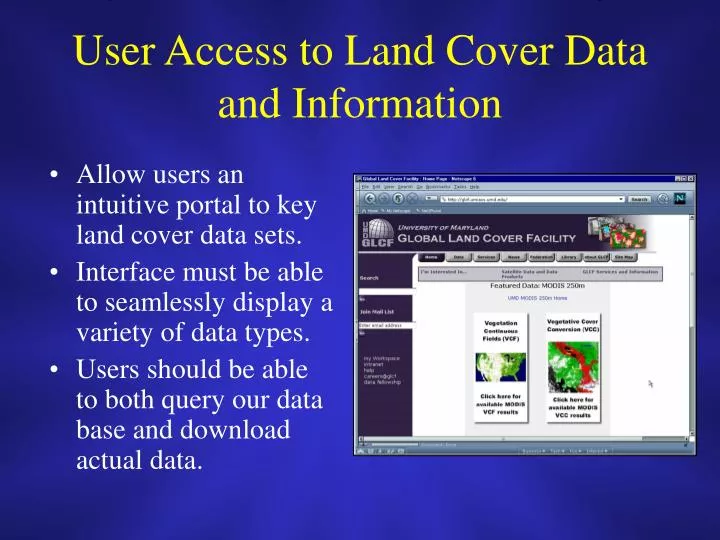
User Access to Land Cover Data and Information. Allow users an intuitive portal to key land cover data sets. Interface must be able to seamlessly display a variety of data types. Users should be able to both query our data base and download actual data.

E N D
User Access to Land Cover Data and Information • Allow users an intuitive portal to key land cover data sets. • Interface must be able to seamlessly display a variety of data types. • Users should be able to both query our data base and download actual data.
Web Accessibility: The Primary Means for Data Distribution • The GLCF internet site is the main portal for displaying and disseminating our land cover data. • Users can gain ready access to known land cover data sets and are able to discover new or complimentary data sets. Raster and Vector Data Sets
The Current GLCF Data Search and Order Applet • A stand alone JAVA applet, avoid mixing html, JAVA and JAVA-script. • Allows users to query the GLCF data holdings using both space and time parameters. • Client-side JAVA proves to be slow and may create compatibility problems with some web browsers.
The GLCF User ‘Work Space’ image preview • The GLCF work space is a virtual location for users to store the outcome of data queries. • The work space allows users to view preview images of selected data. • Users can mark items in their work space to download, order on hard media, save for later viewing, or delete. items in shopping basket ftp links of files
Knowledge of Our User Community: The GLCF User Registration • The user registration allows us to track the types of data our users are storing and accessing. • The registration allows users to directly enter the their individual GLCF work space.
Improving Our Data Access Tools: The ESDI Data Portal Data can be either raw or derived products • A new data access design was undertaken to improve the current web search and order applet. • Design concepts taken from the Human-Computer Interaction Lab (HCIL) have been incorporated. • Built using server side JAVA removing the compatibility problem.
The ESDI Data Portal: Spatial Display • The outcome of data queries are linked to our data base allowing users to instantly see the number of data granules returned. • Standard search parameters of latitude and longitude, or path and row help to quickly restrict queries.
The ESDI Data Portal: Internet Mapping Functions Aid User Searching • We added advanced preview functions that allow dynamic internet-based mapping functions. • GIS based data layers can be displayed along side the outcome of user queries. • Basic navigation tools for pan and zooming of display maps.
The ESDI User Work Space with Added Functionality sort using any column • Work space allows users direct access to their data queries. • The work place becomes the platform for employing additional tools such as subsetting, full resolution viewing, etc. • Users can sort query returns using familiar tools found in spread sheets programs. Comments can be added for each file. ESDI available on-line August 2001
2) On-line AVHRR Processing • Initiated by a collaboration of geography and computer science researchers. • The impetus was to manipulate orbit-based AVHRR data dynamically without prior processing. • Create a flexible user interface so users can apply a variety of functions to the data and create custom products.
KRONOS Details • Customer tailored product generation for AVHRR data • Small query will be processed on line and large query will be queued to our SP2 system and result will be committed to user’s workspace and they can accessed later • Now AVHRR GAC of year 1989 and 1991 is on line. The system is ready to ingest more AVHRR GAC or LAC data. • For large multi-band raw image data, we build a pyramid structure for each band • The corresponding resolution level, band and region is retrieved upon user’s request • Color composite are generated for browsing using different band combination, contrast stretch and brightness.
Examples of BRDF Coefficients from various models for the time period July to September 1983-1986
Advanced Internet Data Manipulation Tools: An On-line AVHRR Processing System - KRONOS • Initiated by a collaboration of geography and computer science researchers. • The impetus was to prepare orbit-based AVHRR data so that science users can have ready access to and efficiently manipulate these large volumes of remotely sensed data. • Create a flexible user interface so users can apply a variety of functions to the data and create custom products dynamically.
KRONOS Abilities • Customer tailored product generation for AVHRR data. • Small queries will be processed on-line and large queries are sent to the SP2 system and results are committed to user’s workspace and they can accessed at any time. High performance computing reduces time needed to process large data sets. • AVHRR GAC of the years 1989 and 1991 are on line. The system is ready to ingest either AVHRR GAC or LAC data. Six additional years of data are currently off-line pending ingestion. • Resolution levels (8, 16 or 32km), bands and spatial regions are retrieved using a web interface. • Color composite are generated for browsing using different band combinations, contrast stretching and brightness controls.
The KRONOS Web Interface: Connects Internet Users to High Performance Computing and Very Large Remote Sensing Data Sets Click and drag on map for defining area of interest Apply atmospheric corrections Menu displays all daily files available Numerous output layers that can be selected in groups or individually
The Preprocessing Schema for Preparing GAC Data for KRONOS • Allowing data to remain in its orbital file structure makes it possible to create products without prior reprojecting of the GAC data • The ingested GAC data allows users to create custom products instead of taking predetermined products
The KRONOS Notification Page: Users are Linked to the Output Data Products Follow link to ftp data
Output Samples of the KRONOS GAC Data Processing System • Continental subsets of bio-physical properties can be processed rapidly - these samples were processed in less than 2 minutes time.
Output Samples of the KRONOS: Research and System’s Testing • Examples of global BRDF coefficients for the time period July to September 1983-1986 using the KRONOS processing system.
KRONOS and Rapid Response to World Events: Flooding of the Limpopo river valley can be clearly seen in the AVHRR images acquired during February 2000. Images shown here are false color composited of AVHRR bands 1, 2 and 3.
Subsetting of Remote Sensing Data and Data Products • Satellite imagery can be very large in file sizes -- hundreds of MB per file. • Users often have very spatially specific needs for remote sensing images. • Today’s realities reflect that network bandwidth is still a constraint for users • Good data management practice dictates to create products as needed not to store never used products. • GLCF research efforts have focused on bringing to production a subsetting tool that is data-type independent.
MODIS 250m Regional Subsets Data Access: Brute Force Method Users select the spatial and temporal MODIS NDVI data set required. The conterminous US NDVI product is distributed in regional subsets.
A Working Prototype for On-line Dynamic Data Subsetting • Users can view imagery at varying resolutions. • Our prototype is based on Landsat imagery • Multiple band combinations can be made and displayed to users before subset is created.
The ESDI Subsetter: Creating an Operational Web-enabled Tool • The ESDI tool provides both spatial and spectral subsetting. • Outputs to multiple file formats, compatible with GIS and image processing industry standards. • A customized “GLCF info” metadata header is provided for the subset. • An example of one of the many server-side applications possible within our GLCF web design structure. • Platform independent application – subsetting is done on our server.
ESDI Subsetter User Interface: The Initial Web Prototype User defines area of interest using a non-JAVA polygon tool Select which bands are of interest, 2 and 3 band composites or select just 1 band Output can be written to a number of commercial software formats
Output from ESDI Subsetter: Data Returns to User Work Space Access to subsetter, Kronos, or other tools Preview of subsetter output The subsetted band(s) with file sizes and metadata file
GLCF Data Interoperability Practice and Research • New data and information systems will become increasingly more dependent on data held at distributed sources. • Participation in the ESIP Federation has accelerated our develop efforts in data exchange protocols. • Take advantage of data base research efforts ongoing within UMIACS.
GLCF Seeks to Interoperate with Other Data Centers via Known Data Standards • Requirement for submitting data set information in DIF format to NASA’s Global Change Master Directory. • Develop scripts to create FGDC metadata files as Landsat data is ingested. This method will soon to be developed for all data held at GLCF. • The development of a ‘GLCF header file’ that provides a project-wide standard and accommodates raw and derived products.
MOCHA (Middleware based on a code shipping architecture): Interoperability Research • Allow queries across multiple data providers. • Ship code to perform functions to where the data is held. • Return only the data requested by the user.
Research Problems Associated with a Middleware Solution • Problem 1: How to deploy the data types and query operators when the middleware connects hundreds of data sites? • Problem 2: How to execute the queries efficiently? How to avoid large data transfers during query processing?
MOCHA’s Distributed Structure Controls the query and submits needed instructions Data base translation services
A user interface and console reveals the network activity associated with each user query • MOCHA Federation Partners included: University of New Hampshire, UMAC, and the Global Hydrology Research Center
Gathering and Evaluation of User Metrics: GLCF Efforts • Metrics help us to understand our user communities’ needs and use of our data products. • The ESIP Federation contracted the GLCF Metrics Team to create tools and monitor the progress of the Federation by gathering regular statistics. • A GLCF staff member is the current Chair person of the Federation Working Group on Metrics. • The GLCF tracks user requests and use of our on-line processing tools. We have modified COTS to monitor user interactions with the numerous on-line tools.
On-line Metrics Tools and Resources for the ESIP Federation • The GLCF hosts a web site for the Federation partners that contains tools, metric definitions and related documents. • The GLCF Metrics Evaluation Team portal serves as the repository for all Federation metrics efforts.
The Metrics Reporting Form • The decentralized structure of the ESIP Federation presents a challenge to gathering metrics. • The GLCF developed an integrated system of web forms connected to our data base to gather Federation metrics. • By ‘lowering the bar’ for users to submit metric data we now collect Federation-wide data 4 times a year.
Project Metrics Reporting Form • The web forms developed at the GLCF allow users to add the appropriate data for the metric category. • In addition, these forms allow users to add comments to clarify data added. • An on-line help system provides rapid access to definitions.
The Metrics Data Viewer • The data viewer provides Federation partners access to the metric data base. • Federation members and Project Management can view the data as it is posted. Custom reports can be generated from the data base. • All data is kept on line so change over time statistics can be accessed.
Users can detail achievements that may be difficult to quantify: Nuggets • ESIP members expressed a need for revealing success stories of their efforts that cannot be readily tied to a quantitative measure. • The GLCF team was able to integrate these strings of information into our metrics data base and provide a way for all to view these data.
We keep in touch with users through an online user survey and suggestion form. • To track how well the GLCF is meeting the needs of its user base we created an on-line user survey with the aid of the HCIL. • This document has become the basis for Federation-wide evaluation efforts and specific user community feedback.
Looking Ahead with Metrics Collection and Evaluation Efforts • Based on the latest reporting quarter of 2001 the Federation has clearly had an impact of providing Earth Science data and products to a diverse user community. • The GLCF is continuing work with the HCIL group to incorporate Federation metric data into exploratory software tools, such as Spotfire.