Download
1 / 8
80 likes | 85 Views
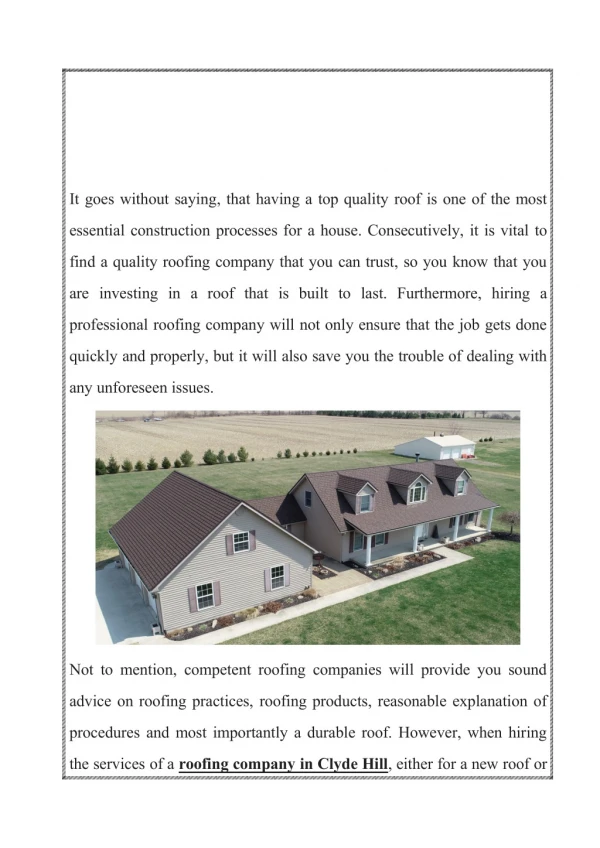
If youu2019re looking for the finest homes in Clyde hill, then contact George Moorhead. We offer a full range of luxury homes from family bungalows to modern executive homes. We buy and sell your Clyde hill home with a clear vision and understanding of what represents value.

E N D
Clyde Hill Market Statistics Updated In Real Time May 2022 is a Seller's market! The number of for sale listings was up 133.3% from one year earlier and up 75% from the previous month. The number of sold listings increased 33.3% year over year and decreased 60% month over month. The number of under contract listings was up 66.7% compared to previous month and down 54.5% compared to previous year. The Months of Inventory based on Closed Sales is 1.8, up 80% from the previous year. The Average Sold Price per Square Footage was down 1.2% compared to previous month and up 37.5% compared to last year. The Median Sold Price increased by 3.1%
from last month. The Average Sold Price also decreased by 10.9% from last month. Based on the 6 month trend, the Average Sold Price trend is "Depreciating" and the Median Sold Price trend is "Neutral". The Average Days on Market showed a neutral trend, an increase of 250% compared to previous year. The ratio of Sold Price vs. Original List Price is 98%, a decrease of 3.9% compared to previous year. Learn More - Schedule A No Obligation Strategy Call It is a Seller's Market Property Sales (Sold) May property sales were 4, up 33.3% from 3 in May of 2021 and 60% lower than the 10 sales last month. Current Inventory (For Sale) Compared to last year, the total number of properties available this month is higher by 4 units of 133.3%. This year's bigger inventory means that buyers who waited to buy may
have a bigger selection to choose from. The number of current inventory is up 75% compared to Home For Sale In Clyde Hill the previous month. Property under contract (Pended) There was an increase of 66.7% in the properties in May, with 5 properties versus 3 last month. This month's pending property sales were 54.5% lower than at this time last year. All reports are published June 2022, based on data available at the end of May 2022, except for today's stats. Information and statistics derived from Northwest Multiple Listing Service. Neither the Board or its MLS guarantees or is in any way responsible for its accuracy. Data maintained by the Board or its MLS may not reflect all real estate activity in the market. Report reflects activity by all brokers participating in the MLS. Learn More - Schedule A No Obligation Strategy Call The Average Sold Price per Square Footage is Neutral* The Average Sold Price per Square Footage is a great indicator for the direction of property values. Since Median Sold Price and Average Sold Price can be impacted by the 'mix' of high or low end properties in the market, the Average Sold Price per Square Footage is a more normalized indicator on the direction of property values. The May 2022 Average Sold Price per Square Footage of $1176 was down 1.2% from $1190 last month and up 37.5% from $855 in May of last year. * Based on 6 month trend – Appreciating/Depreciating/Neutral
The Days on Market Shows Neutral Trend* The average Days on Market (DOM) shows how many days the average property is on the market before it sells. An upward trend in DOM trends to indicate a move towards more of a Buyer’s market, a downward trend indicates a move towards more of a
Seller’s market. The DOM for May 2022 was 14, up 75% from 8 days last month and up 250% from 4 days in May of last year. The Sold/Original List Price Ratio Remains Steady** The Sold Price vs. Original List Price reveals the average amount that sellers are agreeing to come down from their original list price. The lower the ratio is below 100% the more of a Buyer’s market exists, a ratio at or above 100% indicates more of a Seller’s market. This month's Sold Price vs. Original List Price of 98% is down 5.8% from last month and down from 3.9% in May of last year. * Based on 6 month trend – Upward/Downward/Neutral ** Based on 6 month trend – Rising/Falling/Remains Steady All reports are published June 2022, based on data available at the end of May 2022, except for today's stats. Information and statistics derived from Northwest Multiple Listing Service. Neither the Board or its MLS guarantees or is in any way responsible for its accuracy. Data maintained by the Board or its MLS may not reflect all real estate activity in the market. Report reflects activity by all brokers participating in the MLS. Learn More - Schedule A No Obligation Strategy Call The Average For Sale Price is Depreciating* The Average For Sale Price in May in Clyde Hill was $5,654,000, up 83.5% from $3,082,000 in May of 2021 and down 7% from $6,079,000 last month. The Average Sold Price is Depreciating* The Average Sold Price in May was $4,303,000, up 10.3% from $3,902,000 in May of 2021 and down 10.9% from $4,829,000 last month. The Median Sold Price is Neutral* The Median Sold Price in May was $4,438,000, up 27.2% from $3,490,000 in May of 2021 and up 3.1% from $4,305,000 last month. * Based on 6 month trend – Appreciating/Depreciating/Neutral
Learn More - Schedule A No Obligation Strategy Call It is a Seller's Market* A comparatively lower Months of Inventory is more beneficial for sellers while a higher months of inventory is better for buyers.
*Buyer’s market: more than 6 months of inventory Seller’s market: less than 3 months of inventory Neutral market: 3 – 6 months of inventory Months of Inventory based on Closed Sales The May 2022 Months of Inventory based on Closed Sales of 1.8 was increased by 80% compared to last year and up 350% compared to last month. May 2022 is Seller's market. Months of Inventory based on Pended Sales The May 2022 Months of Inventory based on Pended Sales of 1.4 was increased by 403.3% compared to last year and up 7.5% compared to last month. May 2022 is Seller's market. All reports are published June 2022, based on data available at the end of May 2022, except for today's stats. Information and statistics derived from Northwest Multiple Listing Service. Neither the Board or its MLS guarantees or is in any way responsible for its accuracy. Data maintained by the Board or its MLS may not reflect all real estate activity in the market. Report reflects activity by all brokers participating in the MLS. Learn More - Schedule A No Obligation Strategy Call It is a Seller's Market* Absorption Rate measures the inverse of Months of Inventory and represents how much of the current active listings (as a percentage) are being absorbed each month. *Buyer’s market: 16.67% and below Seller’s market: 33.33% and above Neutral market: 16.67% - 33.33% Absorption Rate based on Closed Sales The May 2022 Absorption Rate based on Closed Sales of 57.1 was decreased by 42.9% compared to last year and down 77.2% compared to last month. Absorption Rate based on Pended Sales
The May 2022 Absorption Rate based on Pended Sales of 71.4 was decreased by 80.5% compared to last year and down 4.8% compared to last month.