Download
1 / 70
710 likes | 1.07k Views
John L. Tan, MD, PhD North Texas Heart Center Presbyterian Hospital of Dallas. Testing for Coronary Artery Disease. Cardiovascular Disease Mortality Trends United States: 1979-2002. Deaths in Thousands. Year. Source: CDC/NCHS. . Leading Causes of Death United States: 2002.

E N D
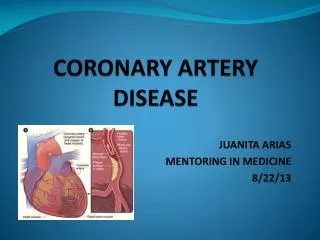
John L. Tan, MD, PhD North Texas Heart Center Presbyterian Hospital of Dallas Testing for Coronary Artery Disease
Cardiovascular Disease Mortality Trends United States: 1979-2002 Deaths in Thousands Year Source: CDC/NCHS.
Leading Causes of Death United States: 2002 Deaths in Thousands A Total CVD (Preliminary) B Cancer C Accidents D Chronic Lower Respiratory Diseases E Diabetes Mellitus F Alzheimer’s Disease Source: CDC/NCHS
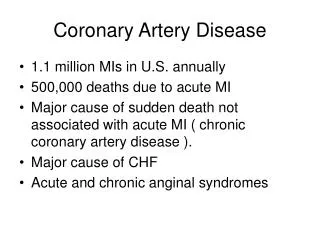
Rate of Myocardial Infarctions Number (Annual) Myocardial Infarction Heart and Stroke Statistical Update. 2002.
Lifetime Risk of CAD Lifetime Risk (%) Age (Years) Lloyd-Jones, DM et al. 1999. Lancet. 353:89
Growing Prevalence of CAD • Larger pool • Population is growing older • Greater Risks • Increasing incidence of Obesity Diabetes Metabolic Syndrome Hypertension
Who Are at Risk? How Can We Identify Them?
The Framingham Score for Risk Prediction Risk: Low <10% Intermediate 10-20% High >20% Greenland and Gaziano, NEJM, 2003
Framingham Risk Score 50 year-old man Total cholesterol 240 Non-smoker HDL 40 SBP 140 mm Hg Framingham Risk Score 10-year Risk 6 4 0 1 1 12 10% (Intermediate)
Framingham Risk Score 45 year-old woman Total cholesterol 240 Smoker HDL 50 SBP 140 mm Hg Framingham Risk Score 10-year Risk 3 8 7 0 3 21 14% (Intermediate)
Limitations of the Framingham Risk Score • Family History of Premature CAD • CRP Levels • Metabolic Syndrome
Elevated hs-CRP as an Independent Risk Factor Ridker et al, NEJM, 2004
Mortality Rates in Adults with Metabolic Syndrome NHANES II: 1976-80 Follow-up Study 13 years average follow-up. Source: Circulation 2004;110:1245-50.
Initial Assessment • Framingham Risk Score • Family History of Premature CAD • CRP Levels • Presence of the Metabolic Syndrome (High triglycerides, Glucose Intolerance, Central Adiposity) • Presence of Diabetes
Now What? “Fear of God” Modify Risk Factors Further Risk Stratify
Available Tests to Detect CAD • Stress ECG • Stress Imaging Study • Ultra-fast CT (EBCT) • CT Angiography • Coronary Angiography
Initial Considerations • Symptomatic versus Asymptomatic • Diagnosis versus Prognosis • Assessment of Risk for CV mortality • Physiological/Functional versus Anatomical
Clinical Classification of Chest Pain Typical Angina (definite) (1) Substernal chest discomfort with a characteristic quality and duration that is (2) provoked by exertion or emotional stress and (3) relieved by rest or nitroglycerin Atypical Angina (probable) Meets 2 of the above characteristics Noncardiac Chest Pain Meets one or none of the typical angina characteristics ACC/AHA ACP-ASIM Guidelines for Chronic Stable Angina, 1999
Pretest Likelihood of CAD in Symptomatic Patients: Percent with significant CAD on catheterization Nonanginal Chest Pain Atypical Angina Typical Angina Age, yrs Men Women Men Women Men Women 30-39 4 2 34 12 76 26 40-49 13351 22 87 55 50-59 20765 319373 60-69 27 14 72 519486 ACC/AHA ACP-ASIM Guidelines for Chronic Stable Angina, 1999
Kaplan-Meier Survival in Risk Stratified Patients Shaw, et al, AJC, 2000
Clinically Useful Bench Marks of Exercise Capacity 1 MET Basal activity level (3.5 ml O2 comsumed/Kg/min < 5 METs Associated with a poor prognosis in patients <65 y/o 5 METs Marks the limit of ADLs, usual limit immediate post MI 10 METs Considered average level of fitness In patients with angina, no mortality benefit CABG vs medical Rx 13 METs Good prognosis in spite of any abnormal exercise test response 18 METs Aerobic master athelete 22 METs Achieved by well-trained competitive atheletes
Four-year Mortality Rates with Abnormal ETT: Effects of Exercise Capacity 4-year Mortality Rates (%) Weiner, et al, JACC, 1984
Exercise Parameters Associated with Advanced CAD or Poor Prognosis 1. Duration of ETT <6.5 METS (<5 METS for women) 2. Exercise HR <120 bpm off b-blockers 3. Ischemic ST segment change at HR <120 bpm or <6.5 METS 4. ST segment depression >2 mm, especially in multiple leads 5. ST segment depression for >6 min in recovery 6. Decrease in BP during exercise
Probability of Significant Disease Across Duke TM Scores Alexander, et al, JACC, 1998
Survival According to Risk Groups Based on Duke TM Scores Risk Group, Score % of Total Survival Mortality, % Low (5 or greater) 62 0.99 0.25 Moderate (-10 to 4) 34 0.95 1.25 High (-10 or less) 4 0.79 5.0 Duke TM Score = Exercise time - (5 x ST deviation) - (4 x Treadmill angina) ACC/AHA ACP-ASIM Guidelines for Chronic Stable Angina, 1999
Meta-analysis of Exercise Testing Number of Sensitivity Specificity Predictive Grouping Studies (%) (%) Accuracy (%) Standard exercise test 147 68 77 73 Without MI 58 67 72 69 Without workup bias 3 50 90 69 With ST depression 22 69 70 69 Without ST depression 3 67 84 75 With digoxin 15 68 74 71 Without digoxin 9 72 69 70 With LVH 15 68 69 68 Without LVH 10 72 77 74 Overall ~70 ~80 ACC/AHA Guidelines for Exercise Testing, 1997
The “Ischemic Ladder” Angina ECG Changes Systolic Dysfunction MVO2 Diastolic Dysfunction Time
Exercise Dobutamine Adenosine (Persantine) Echocardiography Perfusion Imaging Nuclear Scan Thallium Scan Sestamibi Scan Hybrid Scan MRI Stress Imaging Studies Stress Modalities Imaging Modalities
Sensitivity and Specificity of CAD Studies Procedure Sensitivity (%) Specificity (%) Exercise Test 68 77 Stress Echo 76 88 SPECT 88 77 Lee and Boucher. 2001. NEJM. 344:1840
Advantages of Stress Echocardiography 1. Higher specificity 2. Versatility: more extensive evaluation of cardiac anatomy and function 3. Greater convenience/efficacy/availability 4. Lower cost
Advantages of Stress Myocardial Perfusion Imaging 1. Higher technical success rate 2. Higher sensitivity, especially for one-vessel disease 3. Better accuracy in evaluating possible ischemia when multiple rest LV wall motion abnormalities are present 4. More extensive published database, especially in evaluation of prognosis
Patients without Symptoms High Grade Stenoses Diabetics Non-flow Limiting Disease
Abnormal Perfusion Scans in Asymptomatic Diabetics % Abnormal Stress Perfusion Scan A DIAD Study (Wackers et al. 2004. Diabetes Care. 27:1954) B Rajagopalan et al. (Rajagopalan et al. 2005. J Am Coll Cardiol. 45:43) C Cedars-Sinai Group (Zellweger et al. 2004. Eur Heart. 25:543)
Yield of High-Risk Scans in Asymtomatic Diabetics Q waves on ECG 43% Abnormal ECG 26% Peripheral Vascular Disease 28% LDL >100 mg/dl 20% Two or more risk factors 17% Subgroup High-risk Scans Rajagopalan et al. 2005. J Am Coll Cardiol. 45:43
Screening of CAD: ADA Recommendations In asymptomatic diabetic patients with: • Abnormal resting ECG (MI or ischemia) • Peripheral vascular disease • Two or more additional CAD risk factors
Patients without Symptoms Mild CAD Not Detectable by Stress Testing
Myocardial Infarctions and Plaque Severity Burke et al. NEJM. 1997. 336:1276 Myocardial Infarctions (%) 2/3 1/6 1/6 Plaque Severity
Outcomes with Mild CAD TIMI Trials Meta-analysis % Death or Non-fatal MI 1-year follow-up
5-Year Incidence of Coronary Death % n=763 n=274 n=377 MONICA Belgian Substudy Stenosis by Angiography
Available Tests to Detect CAD • Stress ECG • Stress Imaging Study • Ultra-fast CT (EBCT) • CT Angiography • Coronary Angiography
Coronary Calcium Scoring Greenland and Gaziano, NEJM, 2003
Incremental Value of Coronary Calcium Scoring to Risk Assessment Greenland et al, JAMA, 2004
Sensitivity and Specificity of CAD Studies Procedure Sensitivity (%) Specificity (%) Exercise Test 68 77 Stress Echo 76 88 SPECT 88 77 EBCT 80-90 40-50
Population versus Individual Risk “Treating the Herd”