Download
1 / 27
270 likes | 362 Views
A multi-species population assessment model for the Gulf of Alaska. Kray F. Van Kirk, SFOS, UAF, Juneau Terrance J. Quinn II, SFOS, UAF, Juneau Jeremy S. Collie, GSO, URI, Narragansett ftkv @uaf.edu. Sea Grant. Jointly funded by AK and RI Sea Grant

E N D
A multi-species population assessment model for the Gulf of Alaska Kray F. Van Kirk, SFOS, UAF, JuneauTerrance J. Quinn II, SFOS, UAF, Juneau Jeremy S. Collie, GSO, URI, Narragansett ftkv@uaf.edu
Sea Grant • Jointly funded by AK and RI Sea Grant • Also collaboration with North Sea colleagues: Lewy, Vinther (Denmark) • Project started February, 2004 • Species groups • Gulf of Alaska • Georges Bank • North Sea
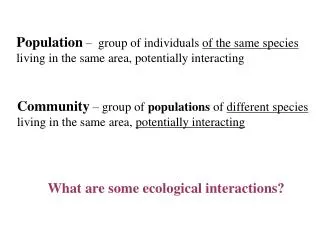
Justification • Crisis in Fisheries Management • Single species analysis does not answer questions of multi-species interactions • Ecosystem approaches desired • Natural mortality is not constant! • Harvest strategies cannot evolve until models do
Previous MSVPA Models • Predation mortality estimated from gut studies • Single predation coefficient • Works backwards from oldest ages • Catch-at-age is measured without error • Applied to North, Baltic and Bering Seas, Georges Bank, and a few tropical areas
Model Overview • Catch-age measured with error • Forward time progression from age 1 recruitment • Cohort abundance subject to fishing, flexible predation, and residual natural mortality
Modeling Predation Mortality Annual Ingestion of Predator Age (grams) = consumption of modeled prey of interest + consumption of non-modeled ‘other food’. Where annual ingestion rate is given by: Growth Increment Hall et al. in press Growth Efficiency
Components of Modeled Prey (1) Predator j of size b preference for prey of size a. • (from Ursin 1971, where size-preference is a function of predator-prey weight-at-age ratio) Predator j preference for prey of species i. • (from AFSC data, as a ratio of prey i consumed relative to total prey consumed; changes over time)
Components of Modeled Prey (2) Suitability of prey i,a to predator j,b : size/age preference * prey preference Availability of prey i,a to predator j,b : prey suitability * prey abundance
Total Annual Consumption Consumption of prey i,a by predator j,b Predator Ingestion Predator Abundance Prey Availability Total Available Food (Modeled Prey And Other Food)
Total Available Food Modeled prey, species i All other prey T.A.F. = Modeled prey + all other prey How to quantify ‘other prey’? - Very little data Use factor to multiply modeled prey (10x, 50x…) to obtain estimated biomass of Other Prey Set multiplier as parameter to be estimated
Predation Mortality ‘P’ Sum of ALL predation on species i age a by ALL ages of predator j Total ‘P’ for prey i,a by predator j Total biomass of species i,a (grams) Total predation on species i,a (grams)
Cohort Abundance Residual Natural Mortality Fishing Mortality Predation Mortality Traditional Natural Mortality ‘M’
Initial Model Set-up Arrowtooth Flounder (Atheresthes stomias) Pacific Cod (Gadus macrocephalus) Walleye Pollock (Theragra chalcogramma)
Initialization Parameters • Abundance at age for year 1(SAFE) • Fixed overall F (Mean 1981 – 2001) • Fixed R (0.1) • Spawner-Recruit alpha and beta • Prey Preference (Mean 1981 – 2001)
Population Trends (SAFE) Arrowtooth Flounder Walleye Pollock Pacific Cod
Initial Results Arrowtooth Flounder Pacific Cod Walleye Pollock • Fishing pressure on pollock too great • Insufficient food available to pollock
Increase ‘Other Food’ factor from 10x to 50x Walleye Pollock Pacific Cod Arrowtooth Flounder BASE CASE SCENARIO
Predation Mortality from Base Case Pollock Pollock ATF Cod ATF Cod ATF
Full Recruitment ‘F’ for pollock at 1 ATF Cod Pollock Predation on ATF 1981 – 2001 Base Case Predation on ATF 1981 – 2001 F = 1 Cod Cod ATF
Full Recruitment ‘F’ for pollock at 1 Other Food factor = 50x Other Food factor = 100x
Full Recruitment ‘F’ for pollock at 0 Pollock Cod ATF Predation on Pollock 1981-2001: Base Case Predation on Pollock 1981-2001: F = 0 Pollock Pollock Cod ATF Cod ATF
Full Recruitment ‘F’ for pollock at 0 Pollock Cod ATF Predation on ATF 1981 – 2001 Base Case Predation on ATF 1981-2001: F = 0 Cod ATF ATF Cod
Model Sensitivities • Prey Abundance • Predator Abundance • Prey preference and ‘Other Food’ factor • Fishing Pressure
Next Steps • Parameter Estimation • Rho (species preference) • Elements of size-preference function • ‘Other food’ multiplier • Objective Functions • Fishery catch at age • Survey catch at age • Stomach contents (predation rates) • Addition of Pacific halibut and Steller Sea Lion
Areas for Exploration • Predation between age classes and connection with fishing pressure • Complexity of multi-species model vs. robustness of single species models • Estimation of recruitment parameters once other parameters are set