Download
1 / 17
170 likes | 308 Views
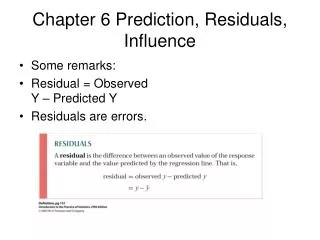
Analyzing Residuals. Grade 9 Lesson 17. Learning Intentions. We are learning to analyze residuals. Success Criteria. We are successful when we can... show a residual plot on a graphing calculator for a set of data.

E N D
Analyzing Residuals Grade 9 Lesson 17
Learning Intentions • We are learning to analyze residuals.
Success Criteria • We are successful when we can... • show a residual plot on a graphing calculator for a set of data. • use a residual plot to decide if a linear model is appropriate for the data set.
Why is looking at the pattern in the residual plot important?
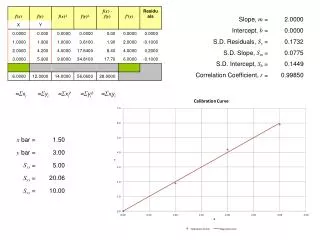
Example 3 • On poster paper and using your group’s data set: • Create a scatter plot of the data. • Find the least-squares regression line and graph this line on your scatter plot. • Create the residual plot. • Be prepared to share your poster and results with the class.
Questions to think about: • Why is it important to look at the residual plot? • Which data sets can be modeled well with linear model and why? • How can you tell if a linear model is a good fit? • Should any of these be modeled by something other than a linear function? How can you tell?
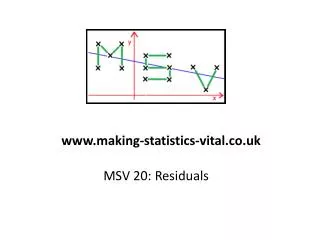
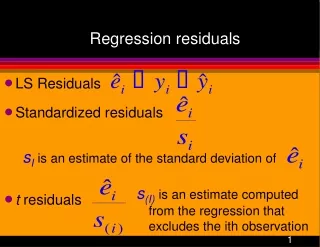
Lesson Summary • After fitting a line, the residual plot can be constructed using a graphing calculator. • A pattern in the residual plot indicates that the relationship in the original data set is not linear.
Exit Ticket • Please go to m.socrative.com • Room number: 029102 • Suppose a scatter plot of bivariate numerical data shows a linear pattern. Describe what you think the residual plot would look like. Explain why you think this.
Learning Intentions • We are learning to analyze residuals.
Success Criteria • We are successful when we can... • show a residual plot on a graphing calculator for a set of data. • use a residual plot to decide if a linear model is appropriate for the data set.
Standards Content standard Practice Standard MP4: Model with mathematics. Students use residuals and residual plots to assess if a linear model is an appropriate way to summarize the relationship between two numerical variables. • S.ID-6b: Informally assess the fit of a function by plotting and analyzing residuals.