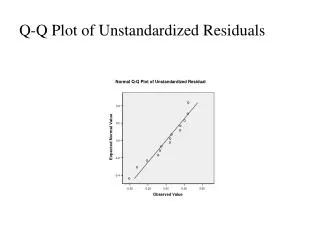
Download
1 / 50
510 likes | 619 Views
Residuals. A continuation of regression analysis. Lesson Objectives. Continue to build on regression analysis . Learn how residual plots help identify problems with the analysis. Case X Y 1 73 175 2 68 158 3 67 140 4 72 207 5 62 115. ^.

E N D
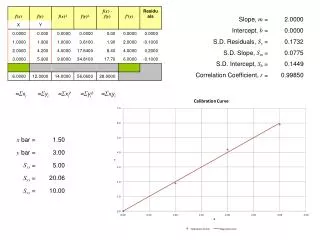
Residuals A continuation ofregression analysis
Lesson Objectives • Continue to build on regression analysis. • Learn how residual plotshelp identify problems with the analysis.
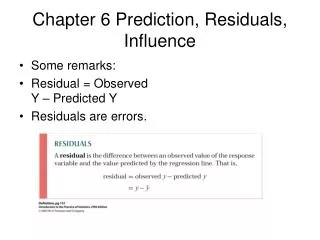
CaseXY 1 73 175 2 68 158 3 67 140 4 72 207 5 62 115 ^ Wt = – 332.73 + 7.189 Ht Example 1: Sample of n = 5 students,Y = Weight in pounds,X = Height in inches. continued … Prediction equation: To be foundlater. r-square = ? Std. error = ?
^ Y = – 332.7 + 7.189X Example 1, continued 220 · 200 · 180 · 160 WEIGHT Residuals = distance from point to line, measuredparallel to Y- axis. · 140 · 120 100 60 64 68 72 76 HEIGHT
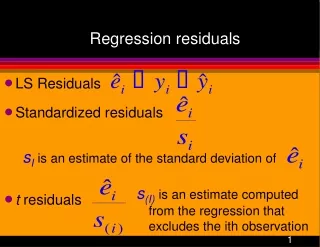
Calculation: For each case, residual = observed value estimated mean ^ ei = yi - yi For the ith case,
Compute the fitted value and residual for the 4th person in the sample; i.e., X = 72 inches, Y = 207 lbs. ^ y = fitted value = 4 ^ y4 - y4 Example 1, continued -332.73 + 7.189() = _________ residual = e4 = = = __________
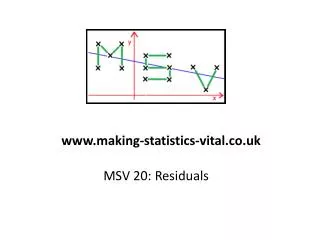
ResidualPlots Scatterplot of residuals vs. the predicted means of Y, Y; or an X-variable. ^
^ Y = – 332.7 + 7.189X Example 1, continued e4 = +22.12. 220 · 200 · 180 · 160 WEIGHT Residuals = distance from point to line, measuredparallel to Y- axis. · 140 · 120 100 60 64 68 72 76 HEIGHT
Example 1, continued · 24 e4 is theresidual for the 4th case,= +22.12. Residual Plot 16 8 · · 0 Residuals · -8 Regression line from previous plot is rotated to horizontal. · -16 -24 60 64 68 72 76 HEIGHT
Residual Plot Scatterplot of residuals versus the predicted means of Y, Y; or an X-variable, or Time. ^ Expect random dispersion around a horizontal line at zero. Problems occur if: • Unusual patterns • Unusual cases
Residuals versus X l l l l l l l l l l l Residuals l 0 l l l l l l l l l Good random pattern X, or time
Residuals versus X l l l l l l l l l l l l l Residuals l l l 0 l l l l l l l Next step: ________ to determineif a recording error has occurred. l Outliers? X, or time
Residuals versus X Next step: Add a “quadratic term,”or use “______.” l l l l l l l l l l l l Residuals l l 0 l l l l l l l l l l l l l l Nonlinear relationship X, or time
Residuals versus X l Next step: Stabilize variance by using “________.” l l l l l l l l l l l l l l l l Residuals l 0 l l l l l l l l l l l l l l l l l l l l Variance is increasing X, or time
Unusual patterns: qPossible curvature in the data. qVariances that are not constant as X changes. Unusual cases: qOutliers q High leverage cases q Influential cases Residual Plots help identify
Three properties of Residuals illustrated with somecomputations.
73 175 68 158 67 140 72 207 62 115 ^ ^ e = Y – Y Y .01 Property 1. Y = Weight X = Height ^ Y = – 332.73 + 7.189 X Residuals XY –17.07 192.07 Find the sum of the residuals. 156.12 1.88 . . . round-off error
1. Residuals always sum to zero. Properties of Least Squares Line Sei = 0.
73 175 68 158 67 140 72 207 62 115 ^ ^ e = Y – Y Y 867.98 .01 Property 2. Y = Weight X = Height ^ Y = – 332.73 + 7.189 X e2 XY 192.07 156.12 148.93184.88112.99 –17.07 1.88 –8.93 22.12 2.01 291.38 3.53 79.74489.29 4.04 Find the sum of squaresof the residuals.
1.Residuals always sum to zero. “SSE for any other line”. Sei2= SSE = 867.98 < Properties of Least Squares Line 2. This “least squares” line produces a smaller “Sum of squared residuals” than any other straight line can.
X = 68.4, Y = 159 Y Property 3. 220 · 200 · 180 · 160 WEIGHT · 140 · 120 100 60 64 68 72 76 X HEIGHT
1. Residuals always sum to zero. 2. This “least squares” line produces a smaller “Sum of squared residuals” than any other straight line can. 3. Line always passes through the point ( x, y ). Properties of Least Squares Line
Illustration of unusual cases: • Outliers • Leverage • Influential
X Y outlier l l l l l l “Unusual point” does not follow pattern. It’s near the X-mean; the entire line pulled toward it. l l l l l l l l l l X
X l Y l “Unusual point” does not follow pattern. The line is pulled down and twistedslightly. l l l l l l l l l l l outlier l l l X
X “Unusual point” is farfrom the X-mean, but still follows the pattern. Y l Highleverage l l l l l l l l l l l l l l X
influential X “Unusual point” is far from the X-mean, but does not follow the pattern.Line really twists! Y l l l l l l l l l l l l l l l l leverage & outlier, X
High Leverage Case: An extreme X value relative to the other X values. Definitions: Outlier: An unusual y-value relative to the pattern of the other cases.Usually has a large residual.
has an unusually largeeffecton the slope of the least squares line. Definitions: continued Influential Case
High leverage Definitions: continued Conclusion: potentially influential. High leverage & Outlier influential!!
The least squares regression line is not resistantto unusual cases. Why do we care about identifying unusual cases?
Lesson Objectives • Learn two ways to use Minitab to runa regression analysis. • Learn how to read output from Minitab.
Example 3, continued … Can height be predicted using shoe size? Step 1? DTDP
Female Male Example 3, continued … Can height be predicted using shoe size? Graph Scatterplot Plot … “Jitter” added in X-direction. The scatter for eachsubpopulation is about the same; i.e., there is“constant variance.”
Example 3, continued … Stat Method 1 Regression Regression … Y = a + bX
Example 3, continued … Copied from “Session Window.” Can height be predicted using shoe size? Regression Analysis: Height versus Shoe Size The regression equation is Height = 50.5 + 1.87 Shoe Size Predictor Coef SE Coef T P Constant 50.5230 0.5912 85.45 0.000 Shoe Siz 1.87241 0.06033 31.04 0.000 S = 1.947 R-Sq = 79.1% R-Sq(adj) = 79.0% Analysis of Variance Source DF SS MS F P Regression 1 3650.0 3650.0 963.26 0.000 Error 255 966.3 3.8 Total 256 4616.3
Least squares estimated coefficients. Example 3, continued … Can height be predicted using shoe size? Regression Analysis: Height versus Shoe Size The regression equation is Height = 50.5 + 1.87 Shoe Size Predictor Coef SE Coef T P Constant 50.5230 0.5912 85.45 0.000 Shoe Siz 1.87241 0.06033 31.04 0.000 S = 1.947 R-Sq = 79.1% R-Sq(adj) = 79.0% Analysis of Variance Source DF SS MS F P Regression 1 3650.0 3650.0 963.26 0.000 Error 255 966.3 3.8 Total 256 4616.3 Total “Degrees of Freedom”= Number of cases - 1
SSRTSS 3650.04616.3 R-Sq = = Example 3, continued … Can height be predicted using shoe size? Regression Analysis: Height versus Shoe Size The regression equation is Height = 50.5 + 1.87 Shoe Size Predictor Coef SE Coef T P Constant 50.5230 0.5912 85.45 0.000 Shoe Siz 1.87241 0.06033 31.04 0.000 S = 1.947 R-Sq = 79.1% R-Sq(adj) = 79.0% Analysis of Variance Source DF SS MS F P Regression 1 3650.0 3650.0 963.26 0.000 Error 255 966.3 3.8 Total 256 4616.3
3.8 S = MSE = Example 3, continued … Can height be predicted using shoe size? Regression Analysis: Height versus Shoe Size The regression equation is Height = 50.5 + 1.87 Shoe Size Predictor Coef SE Coef T P Constant 50.5230 0.5912 85.45 0.000 Shoe Siz 1.87241 0.06033 31.04 0.000 S = 1.947 R-Sq = 79.1% R-Sq(adj) = 79.0% Analysis of Variance Source DF SS MS F P Regression 1 3650.0 3650.0 963.26 0.000 Error 255 966.3 3.8 Total 256 4616.3 Standard Error of Regression.Measure of variation around the regression line. Sum of squared residuals Mean Squared ErrorMSE
Example 3, continued … Can height be predicted using shoe size? Are there anyproblems visiblein this plot? ___________ No “Jitter” added.
Height = 50.52 + 1.872 Shoe Example 3, continued … Can height be predicted using shoe size? Least squares regression equation: Std. error = 1.947 inches r-square = 79.1%, The two summary measuresthat should always begiven with the equation.
Example 3, continued … Can height be predicted using shoe size? Stat Method 2 This program gives a scatterplot with the regression superimposed on it. Regression Fitted Line Plot … Y = a + bX
Example 3, continued … Can height be predicted using shoe size? The fit looks
Example 3, continued … Can height be predicted using shoe size? Regression Analysis: Height versus Shoe Size The regression equation is Height = 50.5 + 1.87 Shoe Size Predictor Coef SE Coef T P Constant 50.5230 0.5912 85.45 0.000 Shoe Siz 1.87241 0.06033 31.04 0.000 S = 1.947 R-Sq = 79.1% R-Sq(adj) = 79.0% Analysis of Variance Source DF SS MS F P Regression 1 3650.0 3650.0 963.26 0.000 Error 255 966.3 3.8 Total 256 4616.3 What information do these values provide?
1 How do you determine if theX-variable is a useful predictor? Use the“t-statistic”or the F-stat. “t” measures how many standard errors the estimated coefficient is from “zero.” “F” = t2 for simple regression.
2 How do you determine if theX-variable is a useful predictor? A “P-value” is associated with “t” and “F”. The further “t” and “F” are from zero,in either direction, the smaller the corresponding P-value will be. P-value: a measure of the “likelihoodthat the true coefficient IS ZERO.”
If the P-value IS SMALL (typically “<0.10”), 3 then conclude: 1. It is unlikely that the true coefficient is really zero, and therefore, 2. The X variable IS a useful predictor for the Y variable. Keep the variable! If the P-value is NOT SMALL (i.e., “> 0.10”), then conclude: 1. For all practical purposes the true coefficient MAY BE ZERO; therefore 2. The X variable IS NOT a useful predictor of the Y variable. Don’t use it.
Example 3, continued … Can height be predicted using shoe size? Could “shoe size”have a truecoefficient thatis actually “zero”? Regression Analysis: Height versus Shoe Size The regression equation is Height = 50.5 + 1.87 Shoe Size Predictor Coef SE Coef T P Constant 50.5230 0.5912 85.45 0.000 Shoe Siz 1.87241 0.06033 31.04 0.000 S = 1.947 R-Sq = 79.1% R-Sq(adj) = 79.0% Analysis of Variance Source DF SS MS F P Regression 1 3650.0 3650.0 963.26 0.000 Error 255 966.3 3.8 Total 256 4616.3 “t” measures how many standard errors the estimated coefficient is from “zero.” P-value: a measure of the likelihoodthat the true coefficient is “zero.” The P-value for Shoe Size IS SMALL (< 0.10). Conclusion: The “shoe size” coefficient is NOT zero!“Shoe size” IS a useful predictor of the mean of “height”.
The logic just explained is statistical inference. This will be covered in more detail during the last three weeks of the course.