Download
1 / 74
740 likes | 896 Views
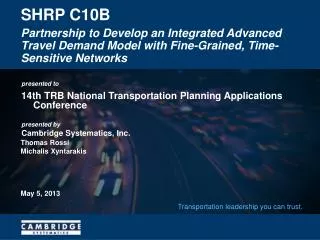
Lesson 2. Utility Conflict Concepts and SHRP 2 R15(B) Research Findings. Seminar Overview. 8:30 AM – 9:00 AM Introductions and Seminar Overview 9:00 AM – 10:15 AM Utility Conflict Concepts and SHRP 2 R15(B) Research Findings 10:15 AM – 10:30 AM Morning Break

E N D
Lesson 2 Utility Conflict Concepts andSHRP 2 R15(B) Research Findings
Seminar Overview 8:30 AM – 9:00 AM Introductions and Seminar Overview 9:00 AM – 10:15 AM Utility Conflict Concepts and SHRP 2 R15(B) Research Findings 10:15 AM – 10:30 AM Morning Break 10:30 AM – 11:45 AM Utility Conflict Identification and Management 11:45 AM – 1:00 PM Lunch Break 1:00 PM – 2:30 PM Hands-On Utility Conflict Management Exercise 2:30 PM – 2:45 PM Afternoon break 2:45 PM – 3:30 PM Use of Database Approach to Manage Utility Conflicts 3:30 PM – 3:45 PM Wrap-Up
Lesson 2 Overview • Utility conflict concepts • SHR2 R15(B) Research findings • Questions and answers
2.1 Utility Conflict Concepts
Utility Coordination Process • QLD: Existing records • QLC: Survey of aboveground utilities • QLB: Geophysical methods • QLA: Exposure (test holes/vacuum excavation)
Reality Check … • Frequently cited reasons for project delays (DOT perspective): • Short timeframe for developing projects • Project design changes • Environmental process delays • Inefficiencies in utility coordination • Inaccurate location and marking of existing utility facilities • Identifying utility conflicts late in the design phase • Disagreements on recommended utility-related solutions • Utility relocation costs not handled properly • …
Reality Check … • Frequently cited reasons for project delays (utility owner perspective): • Limited resources (financial and personnel) • Utility owner’s project development process protocols • Coordination with other stakeholders during design • Coordination with other stakeholders during construction • Changes in DOT design and schedules • Unrealistic schedule by DOT for utility relocations • Internal demands (maintenance, service upgrades)
Consequences of Bad Utility Information • Incomplete/inaccurate utility data = BAD data • Negative impacts: • Disruptions during construction • Unplanned environmental corrective actions • Damage to utility installations • Delays and project overruns
Utility Conflict Scenarios • Utility facility vs. transportation design feature (existing or proposed) • Utility facility vs. transportation construction activity or phasing • Planned utility facility vs. existing utility facility • Noncompliance with: • Utility accommodation statutes, regulations, and policies • Safety or accessibility regulations
Solution Strategies • Remove, abandon, or relocate utilities in conflict • Relocating utilities NOT NECESSARILY OR ALWAYS the best or most cost-effective solution • Modify transportation facility • Protect-in-place utility installation • Accept an exception to policy
Transportation Design Changes • Geometric alignment (horizontal/vertical): • Change grade • Offset centerline, widen one side of highway • Move ramps, driveways • Structure dimensions, other characteristics: • Change embankment slope • Add/modify retaining wall to reduce slope encroachment • Redesign bridge footings and abutments, move pilings • Redesign drainage structures
Example: Widening Both Sides vs. One side of Highway • Issues to consider: • Widening both sides of highway impacts everyone (no one is spared!) • Widening one side can reduce utility impacts • Depends on what kind of utilities are affected
Example: Embankment • Due to interstate widening, embankment had to be raised 50-60 feet • Major gas and water facilities in the area • Large soil settlement expected • Modified project to protect-in-place utilities: • Foam layer • Thin concrete cap • Costly utility relocation was avoided
Example: Bridge • Bridge project affected multiple utilities (power, water, sewer, etc.) • Modifying horizontal bridge alignment slightly • Would have avoided any utility impact • Would not have impacted right-of-way • Would not have compromised bridge construction • Discovered during construction… too late! • Utility relocation costs = $5,000,000
Example: Power Pole • Rapid City, South Dakota • Conflict discovered at 30% detailed design • Redesign avoided utility adjustment • Additional costs were paid by utility
PlanView Profile View Field approach fill Grading cut section Right of Way Line Drainage pipe
New field approach (cross-section) Drainage pipe
Summary of Cost Savings • BHP&L estimate to relocate 69-kVcorner structure $60,000 • Additional cost to add field approach - $3,000 • Cost savings to the BHP&L consumers/taxpayers $57,000
Example: Drainage Channel • Rapid City, South Dakota • Impact discovered during preliminary project scoping inspection • Typical concrete lined drainage ditch would have impacted electrical cabinet and cables • Recommendation: redesign sloped ditch to vertical wall • Additional benefit: elimination of some right of way acquisition
Example: Drainage Channel Approximate centerline of planned drainage ditch
Recommended Redesign Electric cabinet and cables Grading cut section Vertical wall Profile View
Summary of Cost Savings • Qwest estimate to relocate9-Way duct system $750,000 • Additional cost to re-designstorm sewer - $37,270 • Cost savings to the consumers/taxpayers $712,730
Example: Storm Sewer and Communication Duct System • Aberdeen, South Dakota • 5 blocks of communication ducts • 5 vaults (5 feet x 7 feet x 12 feet) connected with 9 4-inch ducts encased in concrete • In conflict with planned storm sewer
Vault and communication ducts Planned 42” storm sewer main trunk line, type “B” drop inlets Redesigned 42” storm sewer main trunk line, type “S” drop inlets
Redesign ofStorm Sewer Main Type S (main trunk under sidewalk) Type B (main trunk under curb & gutter) 42” storm sewer
Summary of Cost Savings • Qwest estimate to relocate9-way duct system $750,000 • Additional cost to re-designstorm sewer - $37,270 • Cost savings to the consumerstaxpayers $712,730
Example: Traffic Signal Footing • Deadwood, South Dakota • Pole to be placed in close proximity to existing utilities • Pole location surveyed on ground by DOT • Utilities in vicinity identified by One Call • High cost to relocate existing utilities • QLA utility investigation • Recommendation: Reduce pole footing diameter from 36” to 30”
Example: Traffic Signal Footing 3 conduits interfere with 36” pole footing diameter Redesign using 30” sonotube (longer, narrower footing)
Summary of Cost Savings • Cost to relocate power facilities $95,000 • Cost to collect QLA data - $5,785 • Cost savings to taxpayers $89,215
Key Concepts • Utility conflict management: • Does not start at 60% design • Does not end at letting • Not all projects or locations need QLB/QLA data • Goal: Avoid or minimize utility impacts • Strategies: • Avoid unnecessary utility relocations • Evaluate design alternatives • Conduct utility conflict analysis
General References • ASCE Standard Guidelines for the Collection and Depiction of Existing Subsurface Utility Data (CI/ASCE 38-02) • AASHTO Guide for Accommodating Utilities Within Highway Right-of-Way (2005) • AASHTO Policy on the Accommodation of Utilities Within Freeway Right-of-Way (2005) • AASHTO Right of Way and Utilities Guidelines and Best Practices (2004) • FHWA Program Guide (2003)
2.2 SHRP 2 R15(B) Research Findings
Background and Objectives • Utility conflict matrix (UCM) an important tool for managing utility conflicts • Objectives: • Review trends and identify best practices for the use of UCMs • Develop a recommended UCM approach and document related processes • Develop training materials for implementing prototype UCM
Research Team • Texas Transportation Institute • Cesar Quiroga (PI), Edgar Kraus • Cardno TBE • Paul Scott, Nick Zembillas, Vinnie LaVallette • Utility Mapping Services • Phil Meis, Tom Swafford • Ash Engineering • Janice Sands Ash, Gary Monday
Project Phases • Phase I (03/09 – 02/10) • Surveys and interviews • Review of national trends • Prototype UCM development • Phase II (03/10 – 10/10) • Work sessions (California, Georgia, Texas) • Training material development • Phase III (11/10 – 07/11) • Training material testing • Implementation guideline development • Final report
Surveys, Interviews, Trends, Prototype UCM • Online survey of 50 states: • 103 responses from 34 states • 82 responses from utility staff, 21 design staff • Headquarters and district level • Follow-up interviews to obtain additional information from DOTs: • 38 interviews with representatives from 23 states