Download
1 / 9
110 likes | 430 Views
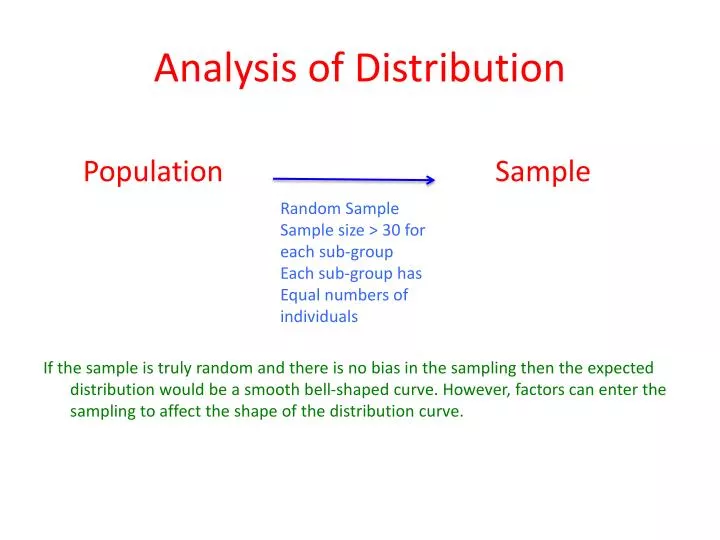
Analysis of Distribution. If the sample is truly random and there is no bias in the sampling then the expected distribution would be a smooth bell-shaped curve. However, factors can enter the sampling to affect the shape of the distribution curve. Population. Sample. Random Sample

E N D
Analysis of Distribution If the sample is truly random and there is no bias in the sampling then the expected distribution would be a smooth bell-shaped curve. However, factors can enter the sampling to affect the shape of the distribution curve. Population Sample Random Sample Sample size > 30 for each sub-group Each sub-group has Equal numbers of individuals
Task In this topic you will be trying to compare the sample distributions of two subgroups taken randomly form a population to determine whether there is enough evidence to answer you question and whether the sample trends will occur in the population also! Population Sample Random Sample Sample size > 30 for each sub-group Each sub-group has Equal numbers of individuals
Mass Of Trout in South Taranaki Rivers Kaupokanui River Waingongoro River F R E Q E N C Y % F R E Q E N C Y % Mass In Grams Mass In Grams
Describing Feature of the Distribution • Clusters: Concentration of data around specific values • Skewness: When the Median and Mean are not aligned • Outliers: Values that lie outside the boundaries of the distribution
Summary Statistics • Minimum • Lower Quartile • Median • Upper Quartile • Maximum • Mean • Standard Deviation
Outliers • An outlier is an observation that lies an abnormal distance from other values in a random sample from a population. In a sense, this definition leaves it up to the analyst (or a consensus process) to decide what will be considered abnormal. Before abnormal observations can be singled out, it is necessary to characterize normal observations.
Outliers • An outlier is an observation that lies an abnormal distance from other values in a random sample from a population. In a sense, this definition leaves it up to the analyst (or a consensus process) to decide what will be considered abnormal. Before abnormal observations can be singled out, it is necessary to characterize normal observations.