Download
1 / 1
10 likes | 116 Views
Skill Set Profile Clustering Based on Student Capability Vectors Elizabeth Ayers (eayers@stat.cmu.edu) Carnegie Mellon University. Background and Motivation. Assistment System Example. Simulated Examples – Data Generation.

E N D
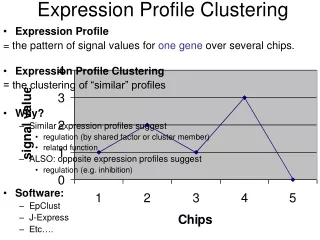
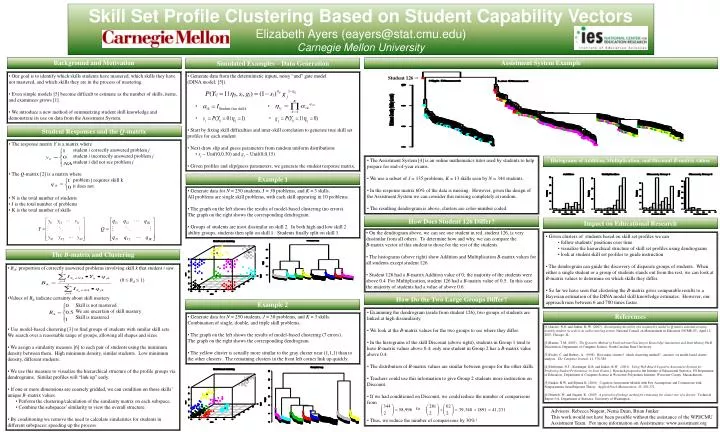
Skill Set Profile Clustering Based on Student Capability Vectors Elizabeth Ayers (eayers@stat.cmu.edu) Carnegie Mellon University Background and Motivation Assistment System Example Simulated Examples – DataGeneration • Our goal is to identify which skills students have mastered, which skills they have not mastered, and which skills they are in the process of mastering. • Even simple models [5] become difficult to estimate as the number of skills, items, and examinees grows [1]. • We introduce a new method of summarizing student skill knowledge and demonstrate its use on data from the Assistment System. • Generate data from the deterministic inputs, noisy “and” gate model • (DINA model; [5]). • • • • • Start by fixing skill difficulties and inter-skill correlation to generate true skill set profiles for each student. • Next draw slip and guess parameters from random uniform distributions • sj ~ Unif(0,0.30) and gj ~ Unif(0,0.15) • Given profiles and slip/guess parameters, we generate the student response matrix. Student 126 Student Responses and the Q-matrix • The response matrix Y is a matrix where • student i correctly answered problem j • student i incorrectly answered problem j • student i did not see problem j • The Q-matrix [2] is a matrix where • problem j requires skill k • it does not • N is the total number of students • J is the total number of problems • K is the total number of skills • The Assistment System [4] is an online mathematics tutor used by students to help prepare for end-of-year exams. • We use a subset of J = 135 problems, K = 13 skills seen by N = 344 students. • In the response matrix 60% of the data is missing. However, given the design of the Assistment System we can consider this missing completely at random. • The resulting dendrogram is above, clusters are color-number coded. Histograms of Addition, Multiplication, and Discount B-matrix values Example 1 • Generate data for N = 250 students, J = 30 problems, and K = 3 skills. • All problems are single skill problems, with each skill appearing in 10 problems. • The graph on the left shows the results of model-based clustering (no errors). • The graph on the right shows the corresponding dendrogram. • Groups of students are most dissimilar on skill 2. In both high and low skill 2 ability groups, students then split on skill 1. Students finally split on skill 3. How Does Student 126 Differ? Impact on Educational Research • On the dendrogram above, we can see one student in red, student 126, is very dissimilar from all others. To determine how and why, we can compare the • B-matrix vector of this student to those for the rest of the students. • The histograms (above right) show Addition and Multiplication B-matrix values for all students except student 126. • Student 126 had a B-matrix Addition value of 0; the majority of the students were above 0.4 For Multiplication, student 126 had a B-matrix value of 0.5. In this case the majority of students had a value of above 0.6. • Given clusters of students based on skill set profiles we can • follow students’ positions over time • visualize the hierarchical structure of skill set profiles using dendrograms • look at student skill set profiles to guide instruction • The dendrogram can guide the discovery of disparate groups of students. When either a single student or a group of students stands out from the rest, we can look at B-matrix values to determine on which skills they differ. • So far we have seen that clustering the B-matrix gives comparable results to a Bayesian estimation of the DINA model skill knowledge estimates. However, our approach runs between 6 and 700 times faster. The B-matrix and Clustering • Bik: proportion of correctly answered problems involving skill k that student i saw. • (0 ≤ Bik≤ 1) • Values of Bik indicate certainty about skill mastery • Skill is not mastered • We are uncertain of skill mastery • Skill is mastered • Use model-based clustering [3] to find groups of students with similar skill sets. We search over a reasonable range of groups, allowing all shapes and sizes. • We assign a similarity measure [6] to each pair of students using the minimum density between them. High minimum density, similar students. Low minimum density, different students. • We use this measure to visualize the hierarchical structure of the profile groups via dendrograms. Similar profiles will “link up” early. • If one or more dimensions are coarsely gridded, we can condition on those skills’ unique B–matrix values. • Perform the clustering/calculation of the similarity matrix on each subspace. • Combine the subspaces’ similarity to view the overall structure. • By conditioning we remove the need to calculate similarities for students in different subspaces; speeding up the process. How Do the Two Large Groups Differ? Example 2 • Examining the dendrogram (aside from student 126), two groups of students are linked at high dissimilarity. • We look at the B-matrix values for the two groups to see where they differ. • In the histograms of the skill Discount (above right), students in Group 1 tend to have B-matrix values above 0.4; only one student in Group 2 has a B-matrix value above 0.4. • The distribution of B-matrix values are similar between groups for the other skills. • Teachers could use this information to give Group 2 students more instruction on Discount. • If we had conditioned on Discount, we could reduce the number of comparisons from • to • Thus, we reduce the number of comparisons by 30%! References • Generate data for N = 250 students, J = 30 problems, and K = 3 skills. Combination of single, double, and triple skill problems. • The graph on the left shows the results of model-based clustering (7 errors). • The graph on the right shows the corresponding dendrogram. • The yellow cluster is actually more similar to the gray cluster near (1,1,1) than to the other clusters. The remaining clusters in the front left corner link up quickly. [1] Anozie, N.O. and Junker, B. W. (2007). Investigating the utility of a conjunctive model in Q-matrix assessment using monthly student records in an online tutoring system. National Council on Measurement in Education (NCME-07), April 12, 2007, Chicago, IL. [2] Barnes, T.M. (2003). The Q-matrix Method of Fault-tolerant Teaching in Knowledge Assessment and Data Mining. Ph.D. Dissertation, Department of Computer Science, North Carolina State University. [3] Fraley, C. and Raftery, A. (1998). How many clusters? which clustering method? - answers via model-based cluster analysis. The Computer Journal, 41, 578-588. [4] Heffernan, N.T., Koedinger, K.R. and Junker, B.W. (2001). Using Web-Based Cognitive Assessment Systems for Predicting Student Performance on State Exams.} Research proposal to the Institute of Educational Statistics, US Department of Education. Department of Computer Science at Worcester Polytechnic Institute, Worcester County, Massachusetts. [5] Junker, B.W. and Sijtsma K. (2001). Cognitive Assessment Models with Few Assumptions and Connections with Nonparametric Item Response Theory. Applied Psych Measurement, 25, 258-272. [6] Stuetzle, W. and Nugent, R. (2007) A generalized linkage method for estimating the cluster tree of a density. Technical Report 514, Department of Statistics, University of Washington. Advisors: Rebecca Nugent, Nema Dean, Brian Junker This work would not have been possible without the assistance of the WPI/CMU Assistment Team. For more information on Assistments: www.assistment.org