Download
1 / 45
470 likes | 495 Views
Learn about using NMR spectroscopy lipid results for intensive lipid management to identify high vs. low risk patients, focusing on LDL particle number distribution and small, dense LDL impacts on atherosclerosis.

E N D
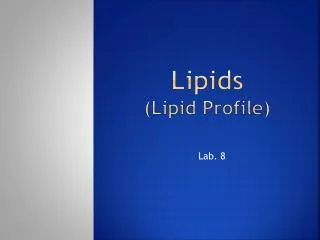
Beyond LDL Cholesterol: NMR Lipid Fractionation and Treating Residual Risk Thomas G. Allison, PhD, MPH Mayo Clinic Rochester, MN
DISCLOSURE Relevant Financial Relationship(s) None Off Label Usage None
Learning Objectives As a result of attending this presentation, participants will be able to: • Address “residual risk” in the secondary prevention of CHD • Appropriately order NMR spectroscopy lipid results for intensive lipid management • Interpret NMR results to identify higher and lower risk patients with the same LDL
PROVE IT - TIMI 22: Study Design 4,162 patients with an Acute Coronary Syndrome < 10 days ASA + Standard Medical Therapy Double-blind “Standard Therapy” Pravastatin 40 mg “Intensive Therapy” Atorvastatin 80 mg 2x2 Factorial: Gatifloxacin vs. placebo Duration: Mean 2 year follow-up (>925 events) Primary Endpoint: Death, MI, Documented UA requiring hospitalization, revascularization (> 30 days after randomization), or Stroke
Changes from (Post-ACS) Baseline in Median LDL-C LDL-C (mg/dL) Median LDL-C (Q1, Q3) 95 (79, 113) 62 (50, 79) 120 100 Pravastatin 40mg 21% 80 60 Atorvastatin 80mg 49% 40 P<0.001 20 <24h Rand. 30 Days 4 Mos. Final 8 Mos. 16 Mos. • Note: Changes in LDL-C may differ from prior trials: • 25% of patients on statins prior to ACS event • ACS response lowers LDL-C from true baseline
PROVE IT:Concomitant Therapies PCI for initial ACS pre-random. 69% Aspirin 93% Warfarin 8% Clopidogrel (initial) 72% (at F/U) 20% B-blockers 85% ACE 69% ARB 14%
0 30 3 6 9 12 15 18 21 24 27 All-Cause Death or Major CV Events in All Randomized Subjects 30 Pravastatin 40mg (26.3%) 25 20 % with Event Atorvastatin 80mg (22.4%) 15 16% relative risk reduction (p = 0.005) 10 5 But absolute residual risk is 22% 0 Months of Follow-up
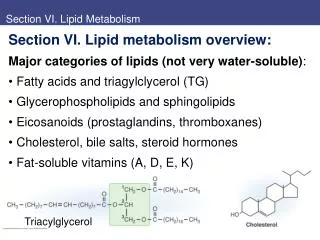
Sources of Residual Risk • Not providing appropriate medical therapy? • Inadequate control of non-lipid risk factors? • Not addressing emerging risk factors? • CRP, Lp(a) • Inadequate control of lipids using LDL target only? • Non-HDL • HDL • Apo B • Small, dense LDL
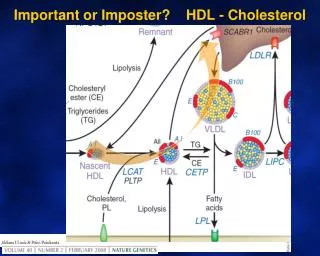
LDL Particles Cause Atherosclerosis Low Density Lipoprotein particles (LDL) are the causal agents in atherosclerosis.1 The more lipoprotein particles a person has, the higher the risk for plaque buildup that causes heart attacks, regardless of how much cholesterol those particles carry. 1 Fredrickson et al. NEJM 1967; 276: 148
130 mg/dL 130 mg/dL LDL Cholesterol Balance 20+ years of studies: Patients with smaller LDL size have greater CHD risk at any given level of LDL-C Lower risk Higher risk Large LDL (Pattern A) Small LDL (Pattern B) But they also have more particles = more Apo B
LDL Particle Number Has Been Repeatedly Shown to be Superior to LDL Cholesterol * Significant and independent in multivariate models adjusted for lipids
LDL Particle Number Has Been Repeatedly Shown to be Superior to LDL Cholesterol * Significant and independent in multivariate models adjusted for lipids
Predicting cardiovascular risk in Women’s Health Study by NMR-determined LDL particle concentration versus size Blake GJ et al: Circ 2002;106:1930-1937
Small, Dense LDL • Modified apo-B has lower affinity for hepatic LDL-receptor • Longer residence time in circulation • More easily oxidized • Easier entry into arterial intima • More readily retained in intima • Atherogenicity twice as great as large LDL particle
LDL Particle Number Distribution in MESA LDL-C <100 mg/dL (n=1,425) 5th 20th 50th 80th percentile 10% (n=141) 42% (n=603) 36% (n=509) 10% (n=150) 2% (n=22) Percent of Subjects 700 1000 1300 1600 (nmol/L) LDL Size (nm) 21.3 (0.7) 20.5 (0.6) 20.1 (0.5) HDL-C (mg/dL) 58 (18) 47 (15) 41 (11) Triglycerides (mg/dL) 98 (60) 136 (71) 199 (75) AHA/ADA “Metabolic Syndrome/Metabolic Risks” meeting. San Francisco, May 3-5, 2006
22% 63% LDL Particle Number Distribution in MESA LDL-C = 100-118 mg/dL 5th 20th 50th 80th percentile 1% (n=10) 24% (n=215) 54% (n=484) 19% (n=168) 3% (n=26) MetSyn (-) (n=903) Percent of Subjects 700 1000 1300 1600 (nmol/L) 0% (n=0) 4% (n=20) 33% (n=153) 46% (n=210) 17% (n=76) MetSyn (+) (n=459) Percent of Subjects 700 1000 1300 1600 (nmol/L) AHA/ADA “Metabolic Syndrome/Metabolic Risks” meeting. San Francisco, May 3-5, 2006
LDL-C LDL-P LDL-C and LDL-P in Framingham Men Having Different Numbers of MetSyn Components N=286 N=407 N=355 N=233 N=113 N=30 LDL-C (mg/dL) LDL-P (nmol/L) 0 1 2 3 4 5 MetSyn (+) MetSyn (-) ~2.3x risk Circulation. 2006;113:20-29
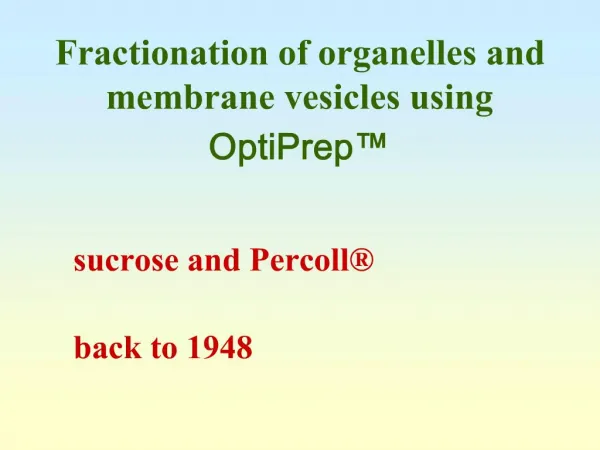
lipoproteins EDTA sugars
Case Study • 62 year old woman presenting with chest pain • S/p prior ischemic stroke • Family history of premature CHD • Mother MI age 52 • Treated hypertension • Hydrochlorothiazide 12.5 mg • Current BP = 145/73 • No smoking or diabetes • Weight = 78.6 kg; BMI = 27.8 kg/m2
Treated Hyperlipidemia • Total cholesterol = 158 mg/dL • HDL cholesterol = 50 mg/dL • LDL cholesterol = 83 mg/dL • Triglycerides = 127 mg/dL • Current Rx = Atorvastatin 10 mg/day • Lp(a) < 7 mg/dL • FBG = 89 g/dL • CRP = 0.9 mg/dL • Homocysteine = 7 µmol/L
Next Step • Do nothing else for lipids? • Increase Atorvastatin? • Add Ezetimibe? • Add niacin?
NMR Results • Total LDL particles = 1300 nmol/L • Small LDL particles = 1140 nmol/L • Total HDL particles = 39 µmol/L • Large HDL particles = 6.6µmol/L • Additional Rx • Niacin 500 mg b.i.d. • Amlodipine 2.5 mg/day
Follow-Up 5 Months • Total cholesterol = 158 150 mg/dL • HDL cholesterol = 50 66 mg/dL • LDL cholesterol = 83 64 mg/dL • Triglycerides = 127 102 mg/dL • Total LDL particles = 1300 752 nmol/L • Small LDL particles = 1140 425 nmol/L • Total HDL particles = 39 43µmol/L • Large HDL particles = 6.6 11.1µmol/L • Weight 78.6 77.6 kg
Conclusions • Despite intervention and aggressive medical therapy, patients continue to have CHD events • This “residual risk” may still be present in some patients despite LDL cholesterol levels at target • NMR spectroscopy represents one potential strategy for identifying residual risk and guiding therapy
Total cholesterol • Questions • Comments LDL cholesterol LDL particle concentration
Case Study #2 • 63 year old man completing cardiac rehab • S/p recent CABG (LIMA LAD) • Prior PCI LAD and Cx • Treated hypertension • Atenolol 50 mg daily; current BP = 118/61 mmHg • Treated hyperlipidemia • Simvastatin 40 mg • Remote past smoking • Weight = 91.8 kg; BMI = 31.8 kg/m2
Treated Hyperlipidemia • Total cholesterol = 152 mg/dL • HDL cholesterol = 48 mg/dL • LDL cholesterol = 73 mg/dL • Triglycerides = 154 mg/dL • Current Rx = Simvastatin 40 mg/day • Lp(a) < 7 mg/dL • FBG = 103 mg/dL
Next Step • Do nothing else for lipids? • Increase Simvastatin? • Add Ezetimibe? • Add niacin?
NMR Results • Total LDL particles = 1200 nmol/L • Small LDL particles = 1008 nmol/L • Total HDL particles = 35 µmol/L • Large HDL particles = 6.5µmol/L • Additional Rx • Ezetimibe 10 mg/day
Follow-Up 10 Weeks • Total cholesterol = 152 138 mg/dL • HDL cholesterol = 48 45 mg/dL • LDL cholesterol = 73 65 mg/dL • Triglycerides = 154 140 mg/dL • Total LDL particles = 1200 1093 nmol/L • Small LDL particles = 1008 943 nmol/L • Total HDL particles = 36 35µmol/L • Large HDL particles = 6.6 6.5µmol/L • Weight 91.8 90.5 kg
Conclusion • Probably the wrong drug was added • A few more large LDL were cleared • Small, dense LDL minimally changed • No improvement in HDL • Now add niacin 500 mg b.i.d.
Spectrum 1 Spectrum 2
PROVE IT Subgroups: Reduction in All-Cause Mortality or Major CV Events 2 Year Event Rates Atorva 80 Prava 40 23.0% 26.2% 20.3% 27.0% 28.8% 34.6% 21.0% 24.6% 28.1% 29.5% 20.1% 25.0% 27.5% 28.9% 20.6% 25.5% 21.7% 26.7% 23.1% 26.0% 20.1% 28.2% 23.5% 25.6% % of Pts 78 22 18 82 30 70 25 75 44 56 27 73 Male Female Diabetes No Diabetes Age > 65 Age < 65 Prior Statin No Prior Statin HDL-C > 40 HDL-C < 40 LDL-C > 125 pi = 0.02 LDL-C < 125 All pinteraction = NS except as noted 0.5 0.75 1.0 1.25 1.5 Atorvastatin 80 mg Better Pravastatin 40 mg Better
COURAGE Long-Term Improvement in Non-Lipid Treatment Targets (Group Median ± SE)
COURAGE Long-Term Improvement in Lipid Treatment Targets(Group Median ± SE)
COURAGEPrimary and Secondary Outcomes Outcome Hazard Ratio (95% Cl) p-value Number of Events