Download
1 / 23
240 likes | 377 Views
Explore the AMI system requirements and capabilities for efficient energy management, outage control, and cost reduction. Learn about the Phased Approach and the TWACS system details and benefits. Discover the deployment status and the added value of TWACS Outage Management. Dive into the data flow and volume insights for enhanced performance.

E N D
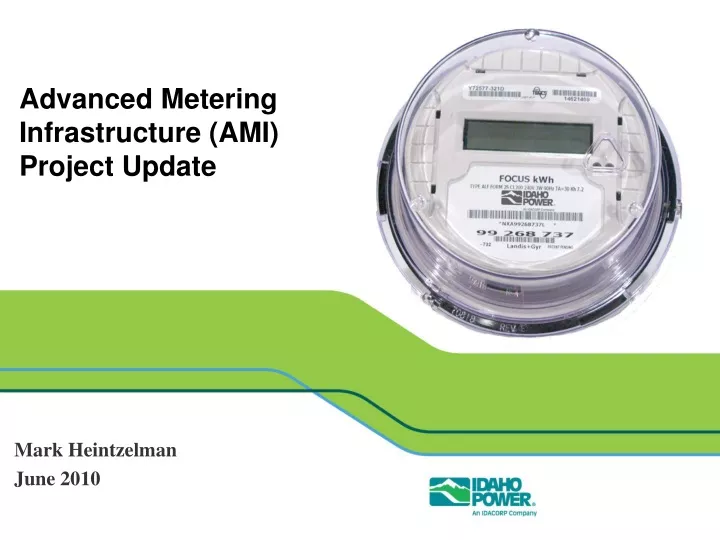
Advanced Metering Infrastructure (AMI) Project Update Mark Heintzelman June 2010
AMI System RequirementsDemonstrated Ability @ Scale • Retrieve hourly energy consumption from all (480,000) endpoints • Two-way communications to reset displayed Peak Demand or kW, on command • Two-way communications to support direct load control • Meet NIST – Critical Infrastructure Protection requirements • Provide outage management process enhancements • Reduce operational costs related to meter reading and customer movement processes
AMI Phased Approach • Phase I – Test the AMI technology – 2004 -2008 • Test hourly data retrieval • Pilot Data Management & time variant pricing • Develop a business case • Phase II – AMI Infrastructure Installation 2009- 2011 • Strategic Sourcing • Regulatory Filing • Infrastructure deployment • O&M cost reduction • Phase III – AMI Full Implementation 2012 • Full data and system integration • System optimization • Additional Systems
TWACS Modules • Meter applications • New Solid-state Meters with factory installed TWACS modules • Residential - Landis & Gyr • Commercial – General Electric • Transponder Switch (outdoor) • AC Cycling/Irrigation Load Control • Control circuit • 30 Amp Direct • water heater/pool pump
Outbound Bit V1 V2 TA TB Inbound Bit 1 3 5 7 2 4 6 8 TWACS PLC Communications Outbound Communication From Distribution Substation Inbound Communication From TWACS Module
Residential Meter Display • Scrolling (3) – Display Check - Peak Demand - kWh • “PD” Peak-Demand OO . OO (08.12 or 20.11 or 00.95) • Power Indicator/disc emulator (forward > Reverse <) • Com Indicator (not used) • Nominal Voltage (on)
Deployment Status • 60+ Sub Stations Complete • 260,000 meters exchanged – 750-1,000 per day • MDMS IEE 5.3 in production • On Schedule • On Budget • PUC Actions • Certificate of Necessity & Convenience (Dec 2008) • Recovery on investment (June 2009 – June 2012) • DOE Stimulus Grant $47 M for Phase III
Added Value • Billing Error & High Bill complaint reductions • Customer Satisfaction • Access issues, Digital meters, Data availability - Web • Enhance DSM (Green) • Enable Time Variant Rates (Green) • Enhanced C2T/GIS/OMS data • Reduction In Vehicle Use (Green) • Distribution Control? – Capacitors? • System Monitoring & Reporting/Data Acquisition • Voltage, Load, PQ, Energy use, Outage, Electrical location
Data Volume • Monthly reading of 500,000 meters X 12 months = 6,000,000 meter reads annually • 250,000 AMI meters X 26 reads daily = 6,500,000 meter reads daily (24 hourly reads + daily kWh & kW reads = 26 reads daily) • 500,000 AMI meters X 26 reads daily = 13,000,000 meter reads daily • 13,000,000 daily reads X 365 = 4,745,000,000 meter reads annually • Additional reads (future) • Voltage • Power Quality • Transponder cycle counts • Meter Data Management System (MDMS) – Bleeding edge
Hard AMI Cost Reductions(the business case) • 99% of Meter Reading Costs ($5.5M annually) • 90% of Customer Movement Costs ($1.5M annually) • Reduction in outage scoping & restoration conformation costs ($363k annually)
Approximate Cost • 3 Years • $74,000,000 • $1.2M - IT – Systems & Interfaces • $13.3M - 142 Station + growth & Communications Equipment Installed • $55.5M – 500,000 Meters Exchanged or installed • 10% contingency and loading • $126 to $140 per endpoint
AMI Phase III (2012) • Implementation of “Mass” Time-Variant-Rates, this will require additional investment (CIS) (stimulus) • DSM Implementation (stimulus) • Direct load control • Indirect load reduction – price signals - TOU • Data analysis • Other Value Added Services (stimulus) • Monitoring • Reporting • Control