Download
1 / 24
250 likes | 293 Views
Explore the major applications and implications of the 2016 Pobal HP Index for targeted resource allocations in education, health, and other sectors. Learn how this index is utilized to address poverty and deprivation in different areas.

E N D
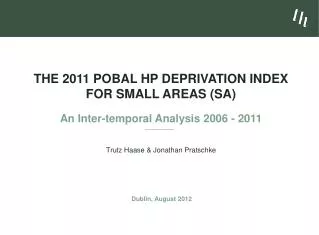
Dublin, 9th November, 2017 The 2016 Pobal HP Deprivation Index for Small Areas (SA)Introduction and Key Findings
The 2016 Pobal HP Deprivation Index- Relative Index Scores2016
Major Applications of the Relative Pobal HP Deprivation Index Local Development: Used by Pobal in the Resource Allocation Model for Local Development Companies under successive Local Development Programmes. Used by Pobal in the roll-out of early-years education initiatives as part of the free Pre-school year. Used by DECLG in the Resource Allocation Model for Local Development Companies funded under LEADER. Used by BIM in the Resource Allocation Model for Fisheries Local Action Groups supported through the European Fisheries Support Fund. Education: Used by the DES for the designation and funding of schools under the disadvantaged schools scheme (DEIS). Will be used by the HEA to monitor the affect of social class on access to and progression in third-level education. In particular, we: use information on the area of residence of drug treatment recipients (where available) to derive count data for EDs identify risk factors or proxy variables that allow us to make ED estimates outside the coverage of existing data sources verify these estimates using available count data at county level map out the resulting estimates We will now describe this process in greater detail and illustrate the results.
Major Applications of the Pobal HP Deprivation Index Health: Used to support research into the predictors of population health (Irish Health Survey, Healthy Ireland, GUI, TILDA, National Drug Treatment Reporting System (NDTRS), National Cancer Registry Ireland, etc.). Central to the Resource Profiler currently being developed by the HSE Health Intelligence Unit and Health Atlas. The Resource Profiler is currently being used to analyse existing resource distributions across the HSE and will increasingly be used in the future to facilitate evidence-based resource allocations across the entire health system. Will be used in the Resource Allocation Model and Performance Measurement Framework for Local and Regional Drug Task Forces (DATF). Used to support strategic management and resource allocations within TUSLA.
Major Applications of the Pobal HP Deprivation Index Other important uses: Used by An Garda Síochána in the profiling of local areas to support community-based policing. Used by the National Transport Authority to optimise the social benefits of alternative route and services design. Used by the Central Statistics Office in the survey design of all of its household surveys (QNHS EU-SILC, etc.). Used by the Central Statistics Office as a predictor for the Residential Property Price Index (RPPI). Used by the Revenue Commissioners to independently assess Local Property Tax. Used by a myriad of research applications in the universities and research centres, as well as private-sector spatial data applications (e.g. used by several health and other insurance companies for their risk asessment models.
Starting Point for the POBAL hp deprivation INdex: A Comprehensive Definition of Poverty “The fundamental implication of the term deprivation is of an absence – of essential or desirable attributes, possessions and opportunities which are considered no more than the minimum by that society.” (Coombes et al., DoE – UK, 1995)
The Underlying Dimensions of The Pobal HP Deprivation Index • Demographic Decline(predominantly rural) • population loss and the social and demographic effects of emigration (age dependency, low education of adult population) • Social Class Deprivation(equally applying in rural and urban and rural areas) • social class composition, education, housing quality • Labour Market Deprivation(predominantly urban) • unemployment, lone parents, low skills base
The Measurement Model of the Pobal HP Deprivation Index d Age Dependency Rate 1 Demographic d Population Change Growth 2 d Primary Education only 3 d Third Level Education 4 d Persons per Room Social Class 5 Composition d Professional Classes 6 d Semi- and Unskilled Classes 7 d Lone Parents 8 Labour Market d Male Unemployment Rate Situation 9 d Female Unemployment Rate 10 • The Pobal HP Deprivation Index is estimated using a multiple group means and covariance structure model • This makes it possible to measure the change that occurred in the mean of the latent variables between 2006, 2011 and 2016
Mapping Deprivation most disadvantaged most affluent
Moving towards evidence-based Resource Allocations: The HSE Resource Profiler Deprived Affluent Above Average Risks Health Risks Below Average Risks (Average Health Risks) SD -3 -2 -1 0 1 2 3 0.1% 2.1% 13.6% 34.1% 34.1% 13.6% 2.1% 0.1% High Moderate Low Source: Haase, Pratschke (2017)
Distribution of AbsoluteHP Index Scores, 2006, 2011 and 2016 most disadvantaged most affluent The Figure shows the decline by 6.8 points in the mean of the Absolute HP Index Scores between 2006 and 2011 (or 0.68 of a standard deviation) and the subsequent recovery by 2.8 Index Scores (or 0.28 of a standard deviation) between 2011 and 2016.
The Urban-Rural Dimension: Changes in Absolute Deprivation, 2006-2016
A New Interest in Health and Education inequalities There is a growing interest in the measurement of the effects of social class on health, education, housing and indeed any area where social inequalities are perceived to exist. Identifying social inequalities is not only important from an equality perspective but is also essential for the design of efficient and effective services. Measuring the effect of social class on health and education outcomes permits the development of evidence-based resource allocation models and facilitates the targeting of resources towards more disadvantaged sections of society, as well as geographical areas of deprivation. The precise measurement of social inequalities thereby plays an important part in the design of performance measurement frameworks and, ultimately, the evaluation of interventions aimed at promoting social inclusion.
Comparison of Relative Deprivation Scores between 2006 and 2016 • The most basic pattern of affluence and disadvantage has remained broadly intact over this 10-year period: affluence is highest in the urban peripheries and gradually declines as one moves towards more rural locations. • There is some indication that the reach of affluent commuter belts has diminished, particularly in the years following the recession. • Within the Greater Dublin Area, there has been a shift in the location of the most affluent areas. • In 2006 the most affluent areas were in the Western part of the GDA • In 2011 and 2016, by contrast, affluence is again most pronounced in the local authority area of Dun Laoghaire/Rathdown (which includes the Local Electoral Areas of Rathgar-Rathmines, Blackrock, Glencullen, Sandyford, Stillorgan and Pembroke –South Dock.
The Urban-Rural Dimension: Changes in Relative Deprivation, 2006-2016
The Urban-Rural Dimension:Changes in Absolute Deprivation, 2006-2016
The Urban Rural Dimension: Changes in Deprivation, 2006, 2011 and 2016 • There is no consistent pattern emerging to answer the question whether either urban or rural areas fared better over the past decade. • All seven categories across the CSO’s urban-rural classification first experienced a significant decline following the 2007/8 recession but also experienced a partial recovery between 2011 and 2016. • The best-faring urban/rural category for the 10-year period from 2006 to 2016 is Dublin City, which declined by only 0.2 HP scores. This is followed by the other four cities and their environs, which declined by 2.7 HP scores. • This clearly points to the advantageous performance of Ireland’s major cities during the recession, but also their ability to benefit faster during the subsequent period of partial recovery. • Large towns (with over 10,00 population) declined by 4.3 HP scores over the ten-year period, followed by medium sized towns and mixed urban/rural areas, each of which declined by 4.6 HP scores. • The worst-affected areas over the ten year period are small towns, which declined by 4.8 HP scores.
Most Affluent and Most Disadvantaged Local Electoral Areas, Relative HP Scores, 2006-2016
The Urban Rural Dimension: Changes in Deprivation, 2006, 2011 and 2016 • The most affluent Local Electoral Area is Rathgar-Rathmines (HP relative of 14.3), followed by Blackrock (13.3), Glencullen-Sandyford (13.2), Stillorgan (12.9), and Pembroke-South Dock (12.7). • The most disadvantaged Local Electoral Area is Cork City North-West (-12.0), followed by Glenties (-10.6), Waterford City South (-9.7), Stranorlar (-9.4), and Longford (-8.0). • Interestingly, the five most disadvantaged LEAs include both urban and rural areas, thus coroborating that the Pobal HP Deprivation Index is equally sensitive to both urban and rural forms of deprivation. • It may come as some surprise to see Cork City North-West and Waterford City being identified as the most disadvantaged LEAs, as there doesn’t exist the same narrative around these areas compared to other more well-known disadvantaged areas in Dublin and Limerick. • The reason for this has probably to do with comparing areas of similar population size. The analysis by Local Electoral Area appears to be particularly useful in this respect, as LEAs are broadly of similar size. • It is also worth noting that there is no systemic effect of the gaps in affluence/deprivation either narrowing or widening over the 10-year period. • .
Most Affluent and Most Disadvantaged Local Electoral Areas: Selective Indicators , 2016