Download
1 / 10
100 likes | 212 Views
Water Utility Carbon Footprint/GHG Emissions Workshop Janice Adair, Department of Ecology September 29, 2009. Two Sides of the Climate Coin. Mitigation: reducing greenhouse gases through Market policies (cap and trade; carbon tax) Traditional air regulation (emission performance standard)

E N D
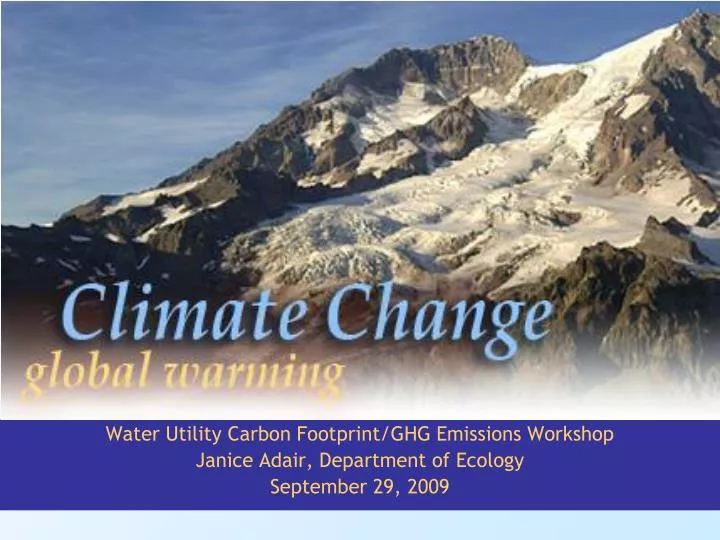
Water Utility Carbon Footprint/GHG Emissions Workshop Janice Adair, Department of Ecology September 29, 2009
Two Sides of the Climate Coin • Mitigation: reducing greenhouse gases through • Market policies (cap and trade; carbon tax) • Traditional air regulation (emission performance standard) • Policies to promote energy efficiencies and reduced use • Adaptation: living with the consequences • Water: too much and too little • Human health: increased heat days; ozone; pests • Biodiversity: impacts on plants and animals
Market Policies • Cap and Trade: • Government sets an overall emissions limit • Permits (allowances) issued up to that limit • Limit decreases over time • Market sets the price of the allowances • Carbon Tax: • Government sets the price (levied on carbon intensity in CO2equivalent) • Market determines the level of reduction 3
Traditional Air Regulation • Clean Air Act • Implemented through compliance with national ambient air standards • Technology based control • Greenhouse gases • Emissions mix in the global atmosphere • What is the compliance measure? • Come from multiple and diverse sources • Few sectors with “best available” or “reasonably available” control technology 5
Comprehensive Approach to Climate Change • Create a market for reductions to reduce the cost of renewable energy and alternative fuels • Limit greenhouse gas emissions • Establish a price on emissions • Implement other policies for reductions that don’t respond to price signals 6
Developing Other Policies • Understand where emissions come from • Transportation: 46%; Electricity: 20%; Industrial: 12% • Residential/Commercial buildings: 9%; Agriculture: 6% • Industrial processes: 4%; Waste: 3% (WA 2005 Inventory) • Develop policies that address those activities • Clean car standards • Incentivize electric vehicles • Renewable fuel standard • Renewable portfolio standard • Improved building codes • Appliance efficiency standards • Clean energy jobs training and retraining • Various tax incentives 7
Two Washington-specific policies • Greenhouse gas reporting • Starts in 2010 for 2009 emissions • 10,000 metric tons annual from stationary sources • 2,500 metric tons annual from fleets • Will request some changes in 2010 session • SEPA • “Interim Advisory” – not prescriptive • Public review ~October • Final in December 8
Cost of Inaction • Climate Impacts Group/UW • Average increases in annual temperature of 2.2°F by the 2020s, 3.5°F by the 2040s, and 5.9°F by the 2080s (compared to 1970 to 1992). • Wetter autumns and winters, drier summers, and small overall increases in annual precipitation (+1 to +2 percent), with increases in extreme high precipitation in western Washington • Lower water supply in summer months - Decreases in spring snowpack by nearly 30 percent are projected across the state by the 2020s, 40 percent by the 2040s and 65 percent by the 2080s. • Climate Leadership Initiative/UO • Total increased costs to the state: 2020: $3.8 billion 2040: $6.5 billion • Average increased costs per household: 2020: $1,250 2040: $1,800 • Costs associated with increased wild fires, reduced salmon populations, increased health care costs, increased storm damage, continued use of less energy efficient technologies 9