Download
1 / 20
200 likes | 362 Views
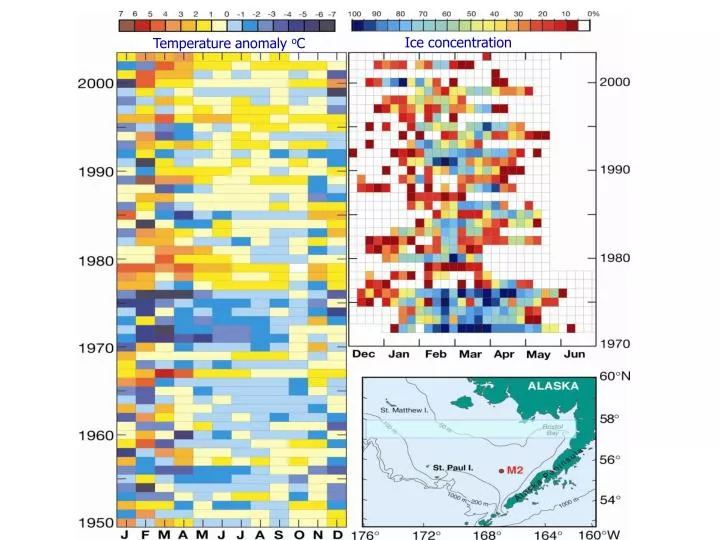
Ice concentration. Temperature anomaly o C. Impacts of Climate Variations on the Bering Sea Ecosystem. Overarching theme: Describing the state of the Bering Sea, and using this information for inter-disciplinary and multi-institution studies. Temperature and fluorescence

E N D
Ice concentration Temperature anomaly oC
Impacts of Climate Variations on the Bering Sea Ecosystem Overarching theme: Describing the state of the Bering Sea, and using this information for inter-disciplinary and multi-institution studies
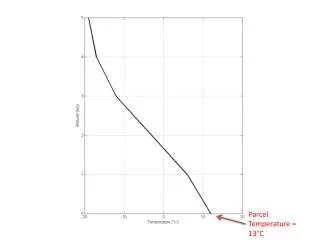
Temperature and fluorescence at Sites 2 (left) and 4 (right)
Bering SeaClimate Indices Grey - Lowest 1/3Pink - Middle 1/3Red - Highest 1/3 1965 1975 1985 1995
0 0 0 2 2 4 Pollock and Bottom Temperature 60oN 58oN 170oW 170 165 160oW 60oN 58oN J Ianelli 0.0 0.25 0.50 0.75 1.0 Relative CPUE
Oscillating Control Hypothesis Hunt et al., 2002
Pollock Recruitmentwith Summer Wind Mixing&Winter Surface Temperature 1978 1982 1989 1996
Northern fur seal pups born on Pribilof Islands St. Paul St. George Error bars are 95% confidence intervals http://nmml.afsc.noaa.gov/alaskaecosystems/nfshome/survey2004pribpups.htm
Walrus herd in the Chukchi Sea– June 2002 [M. Webber-USFWS] Clam food in walrus stomachs [photos courtesy G. Sheffield] Schematic of food web in the northern Bering and Chukchi Seas [Grebmeier and Dunton 2000]
Arctic Bering Sea North Pacific Bering Climate Cold/Dry Arctic Air vs. Warm/Moist Pacific Air 850 mb Temperature: 1-January-1975
5 4 2 Mooring Sites
Final RemarksPresent - Can often go beyond exploratory correlative analysis to scenario testing based on induction.Near Future - Continue monitoring and process studies to refine quantitative understanding of mechanisms.