Download
1 / 18
180 likes | 304 Views
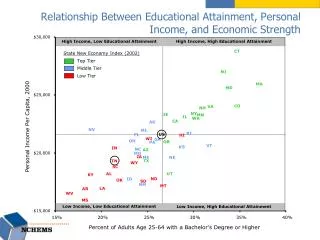
Relationship Between Economic Activity and SO x Emissions: 1950-2000 Version 5 April 22, 2002. Class Project Me 449 Sustainable Air Quality Y. Kuwabara, S. Lahr, B. Ponczak, M Roberts, A. Shaw Instructor: R. Husar Washington University School of Engineering and Applied Sciences.

E N D
Relationship Between Economic Activity and SOx Emissions: 1950-2000Version 5 April 22, 2002 Class Project Me 449 Sustainable Air Quality Y. Kuwabara, S. Lahr, B. Ponczak, M Roberts, A. Shaw Instructor: R. Husar Washington University School of Engineering and Applied Sciences
Air Pollution SOx NOx HC PM Economic Activity-Emission Relationship Activity Consumption Production Emission Industrial, IA Ind. Goods Metals Develop a relationship between the pollutant emission rate SOx and the activities in Industrial, Transport, Residential and Commercial economic sectors. SOx = f ( IA, TA, RA, CA) Transport, TA Ind. Energy ZOther Residential,TA Tr. Energy Coal Commmerc.,CA Res.Energy Oil Com. Energy Gas Land Poll. Electricity Water Poll. Nuclear
Goods Consumption Activity aim=Material Goods/Industrial Activity Material Goods, MG aix=Other X Goods/Industrial Activity Ind. Activity, IA Other Goods, XG aie=Industrial Energy/Industrial Activity Industr. Energy, IE ate=Transport Energy/Transport Activity Transp. Activity,TA Transp. Energy, TE are = Residential Energy/Residential Activity Resid. Activity,RA Resid.Energy, RE ace = Residential Energy / Residential Activity Comm. Activity,CA Commerc. Energy, CE Material Goods Consumption, MG = aim x IA Ind. Other GoodsCons., XG = aix x IA Ind. Energy Consumption, IE = aii x IA Transp. Energy Consumption, TE = ate x TA Resid. Energy Consumption, RE = are x RA Commercial Energy Cons., CE = ace x CA Total Goods & Energy Consumption = MG + IE + TE + RE + CE Total Goods & Energy Consumption = aim xIA + aii x IA + ate x TA + arr x RA + ace x CA
Goods Consumption Material Consumption bmm =MC /MG Material Goods, MG Metals Cons, MC Other Goods, XG bmx =XG /XC bic =(ICC+ILC)/IE XChemical Cons XC Industr. Energy, IE btc =(TCC+TLC)/TE Coal Cons. CC Transp. Energy, TE Resid.Energy, RE brc =(RCC+RLC)/RE Oil Cons, OC Commerc. Energy, CE bcc =(CCC+CLC)/CE Gas Cons, GC Metals Cons., MC = bmmxMG = = aim x bmmIA Coal Cons, CC = bic xIE + btc xTE + brc xRE + bcc xCE = aii x bic xIA + att x btc xTA + arr x brc xRA + acc x bcc xCA Oil Cons, CC = Gas Cons, CC =
Electricity distribution Matrix The coefficients ILS etc. represent electric energy consumed by a given sector by a fuel Ind. Electr. by Coal, ILC Trasp. Electr. by Coal, TLC Resid. Electr. by Coal, RLC Comm. Electr.by Coal, CLC
Material Consumption Emission Air Pollution cms =S/MC SOx, SE Metals Cons, MC NOx, NE cxs =S/XC Chemical Cons, XC HC, HE ccs =S/CC PM, PE Coal Cons. CC cos =S/OC Land Poll., L Oil Cons, OC cgs =S/GC Water Poll., W Gas Cons, GC Nuclear, U Emission relationship to material(metal) and fuel consumption: SOx Emission, SE= cmsxMC+ cxsxXC + ccsxCC + cosxOC + cgsxGC
Emission relationship to goods and energy demand: SOx Emission, SE= cmsxbmmxMG + cxsxbmxxXG +Metals & XOther ccsx(bic xIE + btc xTE + brc xRE + bcc xCE)+ Coal cosx(bio xIE + bto xTE + bro xRE + bco xCE)+ Oil cgsx(big xIE + btg xTE + brg xRE + bcg xCE) Gas Emission relationship to economic activities: SOx Emission, SE= = cmsxbmmxaim x IA + cxsxbmxxaim x IA + ccsx(bic xaii x IA + btc xatt x TA + brc xarr x RA + bcc xacc x CA)+ cosx(bio xaii x IA + bto xatt x TA + bro xarr x RA + bco xacc x CA)+ cgsx(big xaii x IA + btg xatt x TA + brg xarr x RA + bcg xacc x CA)
Industrial Energy by Fuel Since 1970, electricity has become the largest energy source for the industry ‘Green’ – non fossil fuel electricity is becoming a significant energy source
Commercial Residential Sector Indices • The residential and Commercial sector have grown parallel since 1950
Commercial Residential Sector • The person/housing declined but the energy/housing peaked around 1970 • The residential units and the energy use has grown have grown parallel since 1950
Commercial Residential Energy Consumption • Since the 1960s, electricity has become the main energy source • Currently, ‘dirty’ coal and ‘clean’ gas supply the CR energy
Commercial Residential Sox Emissions • Since the 1960s, direct Sox emissions from the CR sector has been minimal • Virtually all the CR Sox emissions are contributed indirectly through the use of electricity
Comm. Res. Sox Emission Factors/Person • Considering only the direct emissions, the em. factors have declined dramatically • Including the indirect EL emissions, the em. factors have declined slightly
CR Causality: Population - Housing - Sox Emissions • In the 1950-1970, the increase of Sox was driven by the population increase • The Sox decline since 1960 was caused by a reduction of emission factors