Download
1 / 45
450 likes | 457 Views
Explore eye movements, saccadic suppression, and useful field of view in visual attention theory. Discuss reading from the iconic buffer and strategies to attract user attention effectively.

E N D
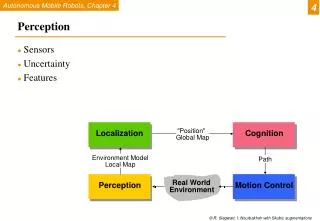
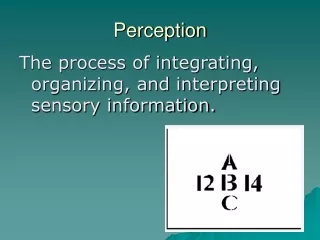
Perception Visual Attention and Information That Pops Out Scales of Measurement
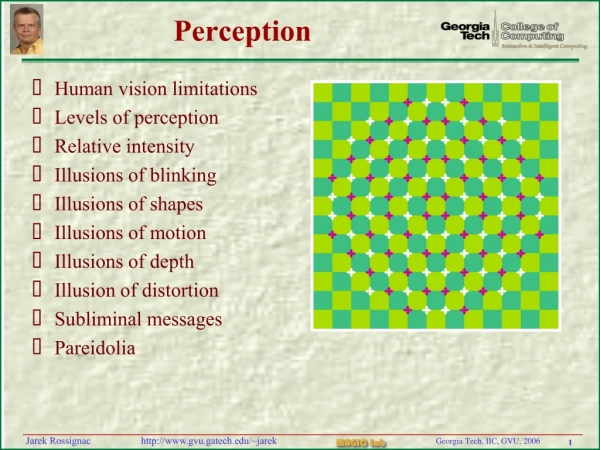
Scales of Measurement • Eye Movement • Visual Attention, Searching, and System Monitoring • Reading From the Iconic Buffer • Neural Processing, Graphemes and Tuned Receptors • The Gabor Model and Texture In Visualization • Texture Coding Information • Glyphs and Multivariate Discrete Data
Scales Of MeasurementOn the Theory of Measurement, S.S. Stevens, Science, 103, pp.677-680. 1946 • Nominal • Ordinal • Interval • Ratio
Nominal • name only, arbitrary, any one-to-one substitution allowed • words or letters would serve as well as numbers • stats: number of cases, mode, contingency correlation • e.g numbers on sports team, names of classes
Ordinal • rank-ordering, order-preserving • intervals are not assumed equal • most measurements in Psychology use this scale • monotonic increasing functions • stats: median, percentiles • e.g. hardness of minerals, personality traits
Interval • quantitative, intervals are equal • no “true” zero point, therefore no ratios • Psychology aims for this scale • general linear group • stats: mean, standard deviation, rank-order correlation, product moment correlation • e.g. Centigrade, Fahrenheit, calendar days
Ratio • determination of equality of ratios (true zero) • commonly seen in physics • stats: coefficient of variation • fundamental (additivity: e.g. weights) • derived (functions of above: e.g. density, force)
Eye Movements • Saccadic Movement • fixation point to fixation point • dwell period: 200-600 msec • saccade: 20-100 msec • Smooth Pursuit Movement • tracking moving objects in visual field • Convergent Movement • tracking objects moving away or toward us
Saccadic suppression • the decrease in sensitivity to visual input during saccadic eye movement • Brain often processing rapid sequences of discrete images • Accommodation • refocusing when moving to a new target at different distances • neurologically coupled with convergent eye movement
Visual Attention, Searching, and System Monitoring • Our visual attention is usually directed at what we are currently fixating on. • Supervisory Control • complex semiautonomous systems, only indirectly controlled by human operators • uses searchlight metaphor
Human-Interrupt Signal • effective ways of computer to gain attention • warning • routine change of status • patterns of events • Visual Scanning Strategies • Elements • Channels, Events, Expected Costs • Factors • minimizing eye movement, over-sampling of channels, dysfunctional behaviours, systematic scan patterns
Useful Field of View (UFOV) • expands searchlight metaphor • size of region from which we can rapidly take information • maintains constant number of targets • Tunnel Vision and Stress • UFOV narrows as cognitive load/stress goes up • Role of Motion in Attracting Attention • UFOV larger for movement detection
4 Requirements of User Interrupt • easily perceived signal, even when outside of area of attention • continuously reminds user if ignored • not too irritating • signal conveys varying levels of urgency
How to attract user’s attention: problems • Difficult to detect small targets in periphery of visual field. • Colour blind in periphery (rods). • Saccadic suppression allows for the possibility of transitory events being missed.
Movement: possible solution • Seen in periphery. • Research supports effectiveness of motion. • Urgency can be effectively coded using motion. • Appearance of new object attracts attention more than motion alone.
Reading from the Iconic Buffer • Iconic Buffer • short-lived visual buffer holds images for 1-2 seconds prior to transfer to short-term/working memory • Pre-attentive Processing • theoretical mechanism underlying pop-out • occurs prior to conscious attention Following examples from Joanna McGrenere’s HCI class slides.
85689726984689762689764358922659865986554897689269898024629968740265576279864890456792327692854609867720989083457980279075904709827908579084772908759082790875498709856749068975786259845690243790472190790709811450856897269846897626897644589226598659865548976892698988568972698468976268976435892265986598655489768926989802462996874026557627986489045679232769285460986772098908345798027907590470982790857908477290875908279087549870985674906897578625984569024379047219079070981145085689726984689762689764458922659865986554897689269898
85689726984689762689764358922659865986554897689269898024629968740265576279864890456792327692854609867720989083457980279075904709827908579084772908759082790875498709856749068975786259845690243790472190790709811450856897269846897626897644589226598659865548976892698988568972698468976268976435892265986598655489768926989802462996874026557627986489045679232769285460986772098908345798027907590470982790857908477290875908279087549870985674906897578625984569024379047219079070981145085689726984689762689764458922659865986554897689269898
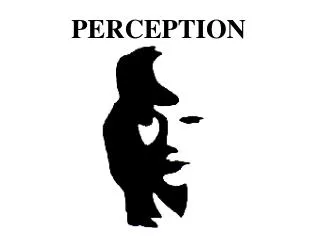
Pop Out • Time taken to find target independent of number of distracters. • Possible indication of primitive features extracted early in visual processing. • Less distinct as variety of distracters increases. • Salience depends on strength of particular feature and context.
Pop Out Examples • Form: • line orientation, length, width • spatial orientation, added marks, numerosity (4) • Colour: • hue, intensity • Motion: • flicker, direction of motion • Spatial Position: • stereoscopic depth, convex/concave shape
Length Shape Width Parallelism Enclosure Curvature Number Spatial grouping Added marks
Rapid Area Judgement • fast area estimation done on basis of colour or orientations of graphical element filling a spatial region • Conjunction Search • combination of features not generally pre-attentive • spatially coded information (position on XY plane, stereoscopic depth, shape from shading) and second attribute (colour, shape) DO allow conjunction search
Neural Processing, Graphemes, and Tuned Receptors • Cells in Visual Areas 1 and 2 differently tuned to: • orientation and size (with luminance) • colour (two types of signal) • stereoscopic depth • motion • Massively parallel system with tuned filters for each point in visual field.
Vision Pathwayhttp://www.geocities.com/ocular_times/vpath2.html • Signal leaves retina, passes up optic nerve, through neural junction at geniculate nucleus (LGN), on to cortex. • First areas are Visual Area 1 and Visual Area 2: these areas have neurons with preferred orientation and size sensitivity (not sensitive to colour)
http://nba5.med.uth.tmc.edu/academic/neuroscience/lectures/section_2/lecture34_04.htmhttp://nba5.med.uth.tmc.edu/academic/neuroscience/lectures/section_2/lecture34_04.htm
http://nba5.med.uth.tmc.edu/academic/neuroscience/lectures/section_2/lecture34_04.htmhttp://nba5.med.uth.tmc.edu/academic/neuroscience/lectures/section_2/lecture34_04.htm
Grapheme • Smallest primitive elements in visual processing, analogous to phonemes. • Corresponds to pattern that the neuron is tuned to detect (‘filter’). • Assumption: rate of neuron firing key coding variable in human perception.
Gabor Model and Texture in Visualization • Mathematical model used to describe receptive field properties of the neurons of visual area 1 and 2. • Explains things in low-level perception: • detection of contours at object boundaries • detection of regions with different visual textures • stereoscopic vision • motion perception
Gabor Function • Response = C cos(Ox/S)exp(-(x² + y²)/S) • C amplitude, or contrast value • S overall size of Gabor function • O rotation matrix that orients cosine wave • orientation, size, and contrast are most significant in modeling human visual processing
Gabor model helps us understand how the visual system segments the visual world into different textual regions. • Regions are divided according to predominant spatial frequency(grain or coarseness of a region) and orientation information • Regions of an image are analyzed simultaneously with Gabor filters, texture boundaries are detected when best-fit filters for one area are substantially different from a neighbouring area.
Trade-Offs in Information Density • The second dogma (Barlow, 1972) • visual system is simultaneously optimized in both spatial-location and spatial-frequency domains • Gabor detector tuned to specific orientation and size information in space. • Orientation or size can be specified exactly, but not both, hence the trade-off.
Texture Coding Information • Gabor model can be used to produce easily distinguished textures for information display (used to represent continuous data). • Human neural receptive fields couple the gaussian and cosine components, resulting in three parameter model: • O orientation • S scale / size • C contrast / amplitude
Textons • combinations of features making up small graphical shapes • Perceptual Independence • independence of different sources of information, increase in one does not effect how the other appears • Orthogonality • channels that are independent are orthogonal • textures differing in orientation by +/- 30 degrees are easily distinguishable
Texture Resolution • Resolvable size difference of a Gabor pattern is 9%. • Resolvable orientation difference is 5°. • Higher sensitivity due to higher-level mechanisms. • No agreement on what makes up important higher order perceptual dimensions of texture (randomness is one example).
Glyphs and Multivariate Discrete Data • Multivariate Discrete Data • data objects with a number of attributes that can take different discrete values • Glyph • single graphical object that represents a multivariate data object
Integral dimensions • two or more attributes of an object are perceived holistically (e.g.width and height of rectangle). • Separable dimensions • judged separately, or through analytic processing (e.g. diameter and colour of ball).
Restricted Classification Tasks • Subjects asked to group 2 of 3 glyphs together to test integral vs. separable dimensions. • Speeded Classification Tasks • Subjects asked to rapidly classify glyphs according to only one of the visual attributes to test for interference. • Integral-Separable Dimension Pairs • continuum of pairs of features that differ in the extent of the integral-separable quality • integral(x/y size)…separable(location/colour)
Multidimensional Discrete Data • Using glyph display, a decision must be made on the mapping of the data dimension to the graphical attribute of the glyph. • Many display dimensions are not independent (8 is probably maximum). • Limited number of resolvable steps on each dimension (e.g. 4 size steps, 8 colours..). • About 32 rapidly distinguishable alternatives, given limitations of conjunction searches.
Conclusion • What is currently known about visual processing can be very helpful in information visualization. • Understanding low-level mechanisms of the visual processing system and using that knowledge can result in improved displays.