Download
1 / 33
330 likes | 489 Views
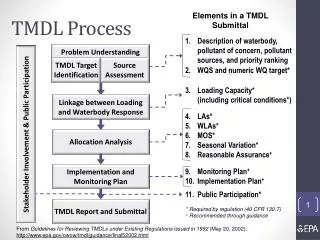
Shingle Creek Chloride TMDL . Abby Morrisette and Josh Kuhn 9/10/11. Shingle Creek. Why is Chloride a Problem?. TMDL focuses on Chloride Inhibits osmo -regulatory processes “Pickles” organism Evidence of decreased i nvertebrate IBI. Chloride Limit.

E N D
Shingle Creek Chloride TMDL Abby Morrisette and Josh Kuhn 9/10/11
Why is Chloride a Problem? • TMDL focuses on Chloride • Inhibits osmo-regulatory processes • “Pickles” organism • Evidence of decreased invertebrate IBI
Chloride Limit • Shingle Creek is Class 2 water for protection of aquatic life • Limits: • Acute: 860 mg/L for one hour duration • Chronic: 230 mg/L over four day average
Sources of Chloride • Major Sources: • Road Deicing • Private Industrial and Residential Deicing • Salt piles • Railway and Airport Deicing • Minor Sources/Transport Mechanisms: • Groundwater Discharge • From Infiltration • Natural Sources • Water Softeners and Septic Systems • Landfills • Fertilizer
Sampling • Sampled from Dec 2002-August 2003 • Assessed historical data • Flows at USGS Queen Avenue Bridge station from May 1996 to December 1998 • Groundwater chloride concentrations from a 1996 USGS study
Conductivity and flow recorded every 15 minutes • Chloride samples collected biweekly and during runoff events.
Quality Control • Conductivity loggers calibrated 3x/year • measurements within 10% of conductivity standards. • Duplicate samples demonstrated <10% difference.
Data Filling • Gaps in data due to frozen conditions and broken data loggers • Gaps filled using regression equations relating the site with the USGS Queen Avenue station • Summer and fall data used to estimate winter discharge. • Spring equations run separately.
GIS • Area of roads calculated using GIS. • Salt applications recorded by Municipality plow drivers used to calculate total salt applications.
Salt Piles • Evaluated for runoff and salt composition.
All point sources are de minimis thus not assigned a waste load allocation.
Source Allocation 87% Road Salt!!!!
“MPCA believes using the 71% target is a conservative assumption that overestimates the chloride reduction needed to achieve WQSs.”
TMDL critiques Places where we thought assumptions and methods were unsound
Chloride-Conductivity Correlation • This is a questionable relationship, with R=0.80 • The graphical fit appears to underestimate high chloride • R values are lower in winter
Lack of Groundwater Analysis “…groundwater interactions with surface waters in the Shingle Creek watershed have not been thoroughly studied.” ~Page 6.10 of TMDL report
Lack of Groundwater Analysis • Load duration curves indicate that groundwater chloride is at standard
Lack of Groundwater Analysis • USGS study of shallow wells indicates temporally variable chloride concentrations from 4.3-370 mg/L • Relationship between surface chloride and groundwater chloride is assumed linear • No data or calculations
Sampling Gaps • No data collected from September to November • For broken data loggers, flows were interpolated from Queen Avenue station, assuming linear regression • Almost all winter flows interpolated, not measured
Queen Avenue Station Analysis • Flow from Queen Ave Station does not account for ~6 mi2 of the watershed • Exclusion accounts for highly developed areas • Flow at Queen Ave may not be linearly related to other flows in the watershed, as assumed
Recommended Chloride Reduction • 71% reduction of chloride, allocated according to source analysis • Over-estimate
Big Task • 71% reduction will require significant resources • Reducing road salt could be a public safety hazard • Alternatives salts could be more hazardous than chloride
Questionable Data? • We need a better understanding of groundwater transport in the watershed • Alot of major assumptions and interpolations were made • Link between IBI and chloride is weak