Download
1 / 29
290 likes | 480 Views
BIOE 201 Final Project Introduction. Tuesday, Sept. 23, 2014. Angiogenesis (neovascularization) growth of new blood vessels from pre-existing microvasculature. Physiologic angiogenesis development exercise wound healing female reproductive organs Over 70 angiogenesis-dependent diseases

E N D
BIOE 201Final Project Introduction Tuesday, Sept. 23, 2014
Angiogenesis (neovascularization) growth of new blood vessels from pre-existing microvasculature • Physiologic angiogenesis • development • exercise • wound healing • female reproductive organs • Over 70 angiogenesis-dependent diseases • Cardiovascular disease • Breast Cancer Non healing ulcer & gangrene - from H.Gornick, Cleveland Clinic
Anti-angiogenic therapies Bevacizumab (Avastin; Genentech): VEGF antibody Ziv-aflibercept(VEGF Trap/Zaltrap; Regeneron): VEGF antibody Sunitinib (Sutent; Pfizer): Tyrosine kinase inhibitor (TKI) Sorafenib (Nexavar; Bayer & Onyx Pharmaceuticals): TKI • Avastin is approved for the treatment of: • Glioblastomamultiforme: most prevalent form of brain cancer • Metastatic colorectal cancer (colon cancer) • Non-small cell lung cancer • Metastatic kidney cancer • Several side effects: • Gastrointestinal perforation • Impaired wound healing • Bleeding • HTN
Some patients are intrinsically resistant to anti-angiogenic drugsAZD2171/Cediranib/Recentin Phase II clinical trial detects decreased tumor enhancement in over 50% of patients Best responding patient: • Decreased tumor size • Decreased vessel size • Decreased permeability Poorly responding patient • No change in tumor size • No change vessel size • No change in permeability Batchelor et al (2007) Cancer Cell
The complexity of VEGF-VEGFR interactions lends itself to systems biology approaches VEGF-A165 VEGF-B167 VEGF-B186 PlGF2 VEGF-A145 VEGF-A165 VEGF-C PlGF2 VEGF-A121 PlGF2 VEGF-B186 GAG N 1 N 2 VEGF-A PlGF VEGF-B VEGF-A121 PlGF1 7 Exons 1-5 VEGF-C PlGF2 7 6 Exons 1-5 VEGF-D VEGF-A145 VEGF-B167 7 6a Exons 1-5 VEGF-A165a VEGF-B186 6b 6a Exons 1-5 VEGF-A165b Exons 1-5 Exons 1-5 7 7 9 8 VEGF-B167 VEGF-B186 PlGF1 PlGF2 VEGF-B PlGF VEGF-A VEGF-A121 VEGF-A145 VEGF-A165 VEGF-A189 VEGF-A209 VEGF-C VEGF-D 6a 6a* 6a Exons 1-5 Exons 1-5 Exons 1-5 Exons 1-5 8 7 7 8 8 8 VEGF-A183 ECM bound s3 VEGF-A189 s2 s1 VEGF-A206 6a 7 8 Exons 1-5 6b 2 2 3 3 2 3 1 1 1 2
Systems biology can be used to examine signaling through receptors
Final project • Develop a systems biology approach for determining how to best target the VEGF-VEGFR signaling axis in angiogenesis. • Using the tools learned in Module 1: Mass Balances: • Systemically examine how signals enter cells (ligand-receptor binding) • How they generate cellular response (second-messenger signaling) • How these signals can be best targeted by drugs (mAbs, small molecules, etc.).
Goals • Determine angiogenic disease you want to treat. • Create a mathematical model simulating VEGF-VEGFR ligand-receptor reaction network in this disease. • Determine which molecule or molecules you will target within the VEGF-VEGFR reaction network. • Quantitatively evaluate the effectiveness of your strategy via model. • Demonstrate the value of your quantitative analytical framework by using it to compare your strategy to current drugs.
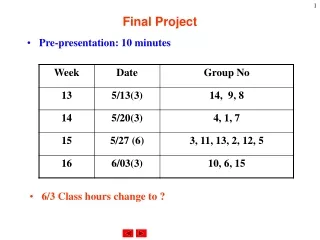
Deliverables • Mid-Semester Project: (presentation and 5 page progress report) • Tuesday, October 14, 2014 (Teams 1-3) • Wednesday, October 15, 2014 (Teams 4-10) • Final Project: (presentation & report): • Tuesday, December 2, 2014 (Teams 8-10) • Wednesday, December 3, 2014 (Teams 1-7)
Mid-Semester Project Report • Importance of VEGF pathway in disease • Ligand-receptor dynamics • Second messenger signaling pathways • Prior modeling • Approach • Preliminary results • Next steps
Mid-Semester Project Report • Importance of VEGF pathway in disease: Your group’s disease of interest. What therapies are currently available to treat this disease? • Ligand-receptor dynamics: What are the VEGF ligands? What are the VEGFRs? Where are these receptors located? What are the kinetics of binding (on/off rates)? • Second messenger signaling pathways: Which downstream molecules are activated by the VEGF-VEGFR axis?
Mid-Semester Project Report • Prior modeling: Do other models exist that focus on this pathway? If so, which ones, and what did they identify? • Approach: What will you model? How will you do it? • Preliminary results: any simulation results • Next steps: what you need to bring it all together
Final Report Structure • Your report should include sufficient section headings to guide the reader through your main points. • You must include the following: • Title Page • Table of Contents • List of Figures/Tables • Introduction • Mathematical Framework • Simulations • Results and discussion • Bibliography • Appendices • Figure and Table Legends
Title Page • Title of your project • Your team number • Names of team members • Abstract: one paragraph summary with a description of major findings.
Table of Contents • The table of contents should be included at the beginning of your report • Includes: • accurate listing of headings • sub-headings, • appendices • All pages should be numbered
List of Figures/Tables • After the Table of Contents, include: • List of Figures • List of Tables • List of Figures: each of the figures found in the report with page numbers. • List of Tables: each of the tables found in the report with table numbers.
Body of Report • Introduction: motivation, an analysis of previous approaches, and the background necessary to understand the question you were asked to solve. • Mathematical Framework: includes the equations that you used with a full description of these equations and a figure that represents your system. • Simulations: what simulations did you carry out and why? • Results and discussion: present a concise summary of your results (using figures and/or tables)
Bibliography • Any information, ideas, figures, content, etc. obtained from another source must be cited. • Reference Managers: • Refworks (free) • Mendeley (free) • Endnote (paid) • Citations should follow American Psychological Association, 6th Edition (APA 6th) format.
Appendices • All feedback (student, TA, and professor) must be included as an appendix. • Including: • any reports/slides with comments • ALL evaluations • You must compile feedback and include a point by point discussion of how you addressed instructor, TA, and student critique in your report.
Figure and Table Legends • A legend should include a title and a description of the key elements in the figure/table. • Each figure should include a figure legend below the figure • Each table should include a table legend above the table.
Formatting • The text should not exceed 5 pages. • Limit your figures to 1 model figure, • 1 parameter summary table, • Up to 4 simulation results/data figures. • The following sections are not included in the page limit: • Title Page • Table of Contents, • List of Figures/Tables, • Bibliography, • Appendices • Single spaced • ½ inch margins • Arial Font, Font size 11 • All pages should be numbered
Rules for good ppt presentations Use University of Illinois templates: • http://identitystandards.illinois.edu/graphicstandardsmanual/othermedia/powerpoint.html • Many template options…
Rules for good ppt presentations • Font sizes should be 18+ • Font type should be a sans-serif (e.g., Arial, Calibri) • Font color should follow the theme • Check speling and grammar¡ • Headings should be descriptive • Animations should be tasteful • Bullet points imply a list and should not be alone…they’re when not in community w/ other bullet points • Color pictures should have a dark background • Cite EVERYTHING
Background color is important for color figures Imoukhuede et al. (2009) Biophysical J
Background color is important for color figures Imoukhuede et al. (2009) Biophysical J
Cite within the slide! Do not save citations until the end! Imoukhuede et al. (2009) Biophysical J
Graphs have a professional appearance Good Graph What to check… Label axes Font type and size 18+ Use scales that make sense (usually start @ 0) Data points/Line graph (colors/style) Simple colors Enclose data with axes Origin preferred graphical software (free @ webstore)
How to prep a bad graph Bad Graph Reasons No label on axes Missing axes Unprofessional font Unreadable font size X-axis has too many increments Scale does not represent data well Unprofessional data points/Line graph (colors/style)
Next Steps • Teach you modeling! • Bring your laptop to class tomorrow and Friday • Download Matlab onto your laptop (along with Simbiology toolbox): webstore.illinois.edu