Download
1 / 16
160 likes | 303 Views
Beam test of Silicon-Tungsten Calorimeter Prototype. 7 th ACFA workshop, Taipei 2004/11/10 Youngdo Oh (Kyungpook National University).

E N D
Beam test of Silicon-Tungsten Calorimeter Prototype 7th ACFA workshop, Taipei2004/11/10 Youngdo Oh (Kyungpook National University) On behalf ofEwha womans University: S.J. Baek, H.J. Hyun, A.L. Jeong, S.W. Nam, I.H. Park, J. Yang Korea University: J.S. Kang, S.K. Park, J.H. ChoiKyungpook National University: Y.D. Oh, K.H. Han, D.H. Kim, J.S. Seo, U.C. YangSeoul City University: I.K. ParkSungkyunkwan University: I.T. Yu, Y.P. YuYonsei University: B.S. Jang, S.H. Jeong, J.H. Kang, Y.J. Kwon
Beam test Condition Beam Test : Aug. 30 – Sep. 7 2004 SPS : 400GeV proton beam Beam interaction with a target (T2) Beam cycle length 18.0 sec. 4.8 sec spill length User controls test beam particle type, energy(10,20,30,50,80,100,150 GeV), focus, and the intensity Test beam energy accuracy +/- 0.3% Beam particle purity > 95%
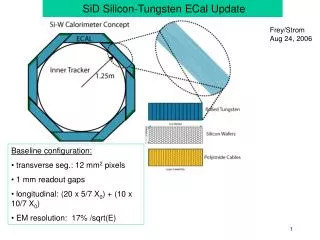
Tungsten and mechanics Tungsten size : 65.5 mm X 57.5 mm ( ~ sensor size) purity : close to 99% ( Rm = 9mm) thick : 3.5 mm (= 1 X0)
Sensor and analog electronics The heritage from space experiment 1mm inactive gap between sensors Silicon Sensor 32 pixels in a layer 131mm X 115mm Analog Board Aluminum 1.5mm pcb structure 10 mm Tungsten 3.5 mm Aluminum 1.5 mm 15 mm Rt= a layer / tungsten = 15.0/3.5 = 4.8 (CALICE ~ 2) Eff. Rm = 9mm * (1 + Rt) = 52mm Total 20 layers = 20 X0, 30cm thick 19 layers of shower sampling
Assembly & Mechanic support Tungsten 1X = 35mm Rt= a layer / tungsten = 150/35 = 4.8 (CALICE ~ 2) Total 20 layers = 20X (a CALICE prototype.: 30 layers 30X)
Beam Test Activity 1. Tunning time delay 2. Detector Alignment run 3. MIP calibration of all channels (no tungsten) 4. Data Run (20 layers) (electron 150,100,80 50,30,20,10 GeV hadron 150 GeV muon 150 GeV) 5. Data Run (10 layers) : to study transverse shower profile beam
Monitoring data & alignment Detector alignment Data monitor : online, offline
Data Summary (50GB) Beam Beam Energy (GeV) files Etc 4x4x20 Muon 150 23 TD Check Electron 50 33 TD Check Pion 150 35 Sensor scan 4x4x20 Tungsten Pion 150 12 Muon 150 42 Electron 150,100, 80,50, 30 ,20 ,10 399/37~89 3 4x8x10 Tungsten Pion 150 Muon 150 18 Electron 150, 100, 50, 20 162/36~48
Channel Scan for MIP calibration • Channel summary • noisy(~10%) • ADC unstable(~5%) • deal channels (~5%) One panel of sensor shown as an example
Gain Calibration of Individual Channels • 150 GeV Muon Beam • Scan over All 640 Channels • Size of signal from the pedestal level of a channel is used to calibrate the channel • S/N (signal to noise rate) = 5.2 (5243 -5207)/7.2 Pedestal : Gaussian Fit Mean : 5206.9 Sigma : 7.2 Signal : Landau Fit Peak : 5243 ADC Counts
Detector Response to Different Particles First look of data Just sum of all channels Including noisy, bad and dead channels Not optimized detector No calibration No beam position information considered 50 GeV Electron 50 GeV pion 150 GeV Muon Total ADC of an event / 640
Detector Response to Electron Beam(sum of all channel) First look of data 150 GeV Electron 100 GeV Electron 80 GeV Electron 50 GeV Electron 30 GeV Electron 20 GeV Electron 10 GeV Electron Total ADC of an event / 640
Calorimeter Calibration : ADC vs. Beam Energy First look of data Very preliminary Total ADC above pedestal / 640 Fit to Straight Line -> Slope 4.2 (ADC/GeV) Electron Energy in GeV
Energy Resolution vs Energy First look of data Very preliminary dE / E (%) Electron Energy in GeV
Summary • 1. Beam test of Silicon-Tungsten during Aug. 30 to Sep. 7 at CERN • 2. ~50GB data collected using electron, muon and pion beam • 3. Analysis is under way • : noisy, unstable, dead channel. leakage due to large effective RM (52mm) • not optimized electronics and detector for LC calorimeter • 4. Require detailed MC study for the accurate geometry • 5. Si/W Detector is working . • The result will be presented in next LCWS. • 6. In Korea, R&D for LC calorimeter is going on. • This beam test experience will give positive idea for R&D activity.