Download
1 / 28
280 likes | 365 Views
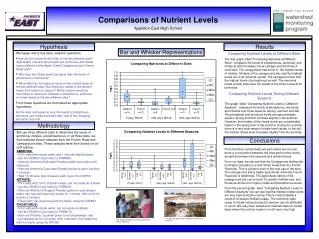
Statistics and Nutrient Levels. Julie Stahli Metro Wastewater Reclamation District March 2010. MMI. Version 3 lacks a lot of the problems that previous versions contained. Statistically, the model distinguishes reference sites from stressed sites.

E N D
Statistics and Nutrient Levels Julie Stahli Metro Wastewater Reclamation District March 2010
MMI • Version 3 lacks a lot of the problems that previous versions contained. • Statistically, the model distinguishes reference sites from stressed sites. • The level chosen as the level of impaired is statistically generous.
MMI Issues (based on Metro Data) • Comments should focus on implementation • Sites with low scores should be put on the M&E list and multiple samples should be taken. • Implementation should be based on median of all MMI scores over the course of five years. • We have seen substantial variation at a single site. • Big rivers need alternative indexes when sites are found in the “yellow zone”.
Sample Data Blue indicates attainment,red indicates impaired
Lets assume that the MMI is valid and can be related to nutrient concentrations to form TP and TN limits….
Regression analysis • Lots of types of regression analysis • linear • Multi-linear regression • logistic regression • etc
Regression analysis • Each type has restrictions on how it is used based on the assumptions we can make about the data. • Evaluate the assumptions to determine whether or not the model is valid or appropriate. • Example assumptions • The relationship is linear in nature. • The errors are independent and normally distributed. • The model is the best available for describing the relationship.
Regression analysis • After the model is developed, we evaluate the model to see how useful it is • Tools for evaluation: • R2 value • Goodness of fit for data • Confidence intervals • Residual mean-squared error • Ideally, a model on which decisions are based are both valid and useful.
Quantile Regression • Breaks up the data into quantiles and forms an individual regression for each one. • Used with the wedge plot.
Quantile Regression • Typically, no assumptions are necessary. • Lots of decisions are made during the modeling process. • Typically, goodness of fit is evaluated in two ways: • examining whether or not the slope is different from zero • The P value for the model (is it significant) • Results are not predictive. • Can’t really determine whether or not the model is valid or useful.
Quantile Regression • Used to explore patterns in data that cannot be seen using more traditional methods. • Designed to be used in exactly the same way that CDPHE is using it – to illuminate an effect that may be muddied by lots of other variables. There is no way to evaluate whether or not the model is right or wrong, good or bad and should be considered as part of a weight of evidence approach.
Quantile Regression What else do we use? We don’t believe there is a better tool to solve the nutrient problem. Especially for Phosphorus. P
What??!? • The uncertainty in the model needs to be acknowledged. • Using this method should not set precedent for future usage where other options may be available. • In repeating their methods, we found that choices were made that are not scientifically valid.
Problems • Using log scale. • Using only the warm data to define the slope. • Using the 90th percentile without biological reason (85% is more commonly used). • Nitrogen is difficult because of lack of data. • Unless otherwise noted, all limits would apply to Warm streams and rivers.
Normal regression Using a log-scale Log Scale Issues
Using all data Using warm data Using only warm data ***Both using log scales to make comparable
Nitrogen • Valid models with the normal data if cold and warm are looked at together as recommended for Phosphorus. • Strongest scientific model (at 0.9 quantile) gives TN value of 2.06 mg/L. • Currently there is a paucity of data and I think we could argue for more information after the implementation of ammonia and nitrite criteria.
Caveats • I am not an expert in quantile regression and may have missed some qualifying assumptions. • All of the relationships we are discussing are tenuous at best, but may qualify as best current scientific opinion.
Thank you…. Questions???