Download
1 / 1
10 likes | 108 Views
First X-Ray Results from the Optically Selected Red Sequence Cluster Survey (RCS) at Z ~ 1. Amalia K. Hicks, Erica Ellingson, Howard Yee, Tesla Jeltema, Mark Bautz, Mike Gladders, Gordon Garmire. Abstract.

E N D
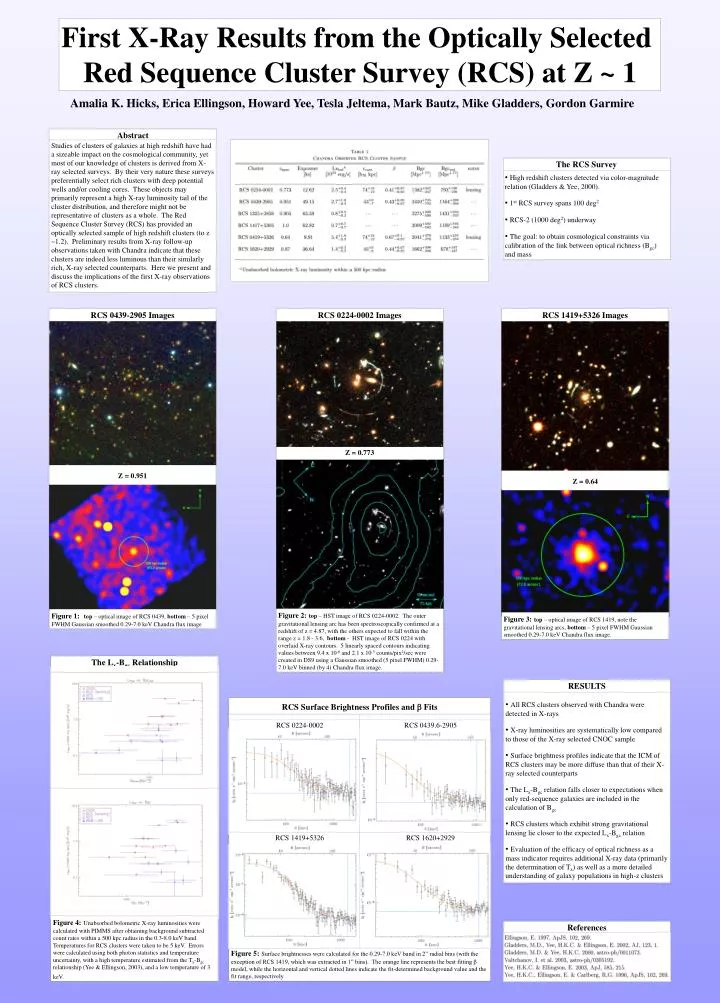
First X-Ray Results from the Optically Selected Red Sequence Cluster Survey (RCS) at Z ~ 1 Amalia K. Hicks, Erica Ellingson, Howard Yee, Tesla Jeltema, Mark Bautz, Mike Gladders, Gordon Garmire Abstract Studies of clusters of galaxies at high redshift have had a sizeable impact on the cosmological community, yet most of our knowledge of clusters is derived from X-ray selected surveys. By their very nature these surveys preferentially select rich clusters with deep potential wells and/or cooling cores. These objects may primarily represent a high X-ray luminosity tail of the cluster distribution, and therefore might not be representative of clusters as a whole. The Red Sequence Cluster Survey (RCS) has provided an optically selected sample of high redshift clusters (to z ~1.2). Preliminary results from X-ray follow-up observations taken with Chandra indicate that these clusters are indeed less luminous than their similarly rich, X-ray selected counterparts. Here we present and discuss the implications of the first X-ray observations of RCS clusters. The RCS Survey • High redshift clusters detected via color-magnitude relation (Gladders & Yee, 2000). • 1st RCS survey spans 100 deg2 • RCS-2 (1000 deg2) underway • The goal: to obtain cosmological constraints via calibration of the link between optical richness (Bgc) and mass RCS 0439-2905 Images RCS 0224-0002 Images RCS 1419+5326 Images Z = 0.773 Z = 0.951 Z = 0.64 Figure 2:top – HST image of RCS 0224-0002. The outer gravitational lensing arc has been spectroscopically confirmed at a redshift of z = 4.87, with the others expected to fall within the range z = 1.8 - 3.6, bottom - HST image of RCS 0224 with overlaid X-ray contours. 5 linearly spaced contours indicating values between 9.4 x 10⁻⁶ and 2.1 x 10⁻⁵ counts/pix2/sec were created in DS9 using a Gaussian smoothed (5 pixel FWHM) 0.29-7.0 keV binned (by 4) Chandra flux image. Figure 1:top – optical image of RCS 0439, bottom – 5 pixel FWHM Gaussian smoothed 0.29-7.0 keV Chandra flux image Figure 3:top – optical image of RCS 1419, note the gravitational lensing arcs, bottom – 5 pixel FWHM Gaussian smoothed 0.29-7.0 keV Chandra flux image. The Lx-Bgc Relationship RESULTS • All RCS clusters observed with Chandra were detected in X-rays • X-ray luminosities are systematically low compared to those of the X-ray selected CNOC sample • Surface brightness profiles indicate that the ICM of RCS clusters may be more diffuse than that of their X-ray selected counterparts • The Lx-Bgc relation falls closer to expectations when only red-sequence galaxies are included in the calculation of Bgc • RCS clusters which exhibit strong gravitational lensing lie closer to the expected Lx-Bgc relation • Evaluation of the efficacy of optical richness as a mass indicator requires additional X-ray data (primarily the determination of Tx) as well as a more detailed understanding of galaxy populations in high-z clusters RCS Surface Brightness Profiles and b Fits RCS 0224-0002 RCS 0439.6-2905 References RCS 1419+5326 RCS 1620+2929 Figure 4:Unabsorbed bolometric X-ray luminosities were calculated with PIMMS after obtaining background subtracted count rates within a 500 kpc radius in the 0.3-8.0 keV band. Temperatures for RCS clusters were taken to be 5 keV. Errors were calculated using both photon statistics and temperature uncertainty, with a high temperature estimated from the Tx-Bgc relationship (Yee & Ellingson, 2003), and a low temperature of 3 keV. References Figure 5:Surface brightnesses were calculated for the 0.29-7.0 keV band in 2” radial bins (with the exception of RCS 1419, which was extracted in 1” bins). The orange line represents the best fitting b model, while the horizontal and vertical dotted lines indicate the fit-determined background value and the fit range, respectively.