Download
1 / 34
340 likes | 511 Views
Integrated Environmental Strategies and Co-Benefits. Jack Fitzgerald, USEPA Jose Ramon T. Villarin, SJ, PhD. Presentation Overview. Introduction to Co-benefits Background on IES Case Studies – Manila, Beijing and Santiago Select Partner Achievements Partner Support

E N D
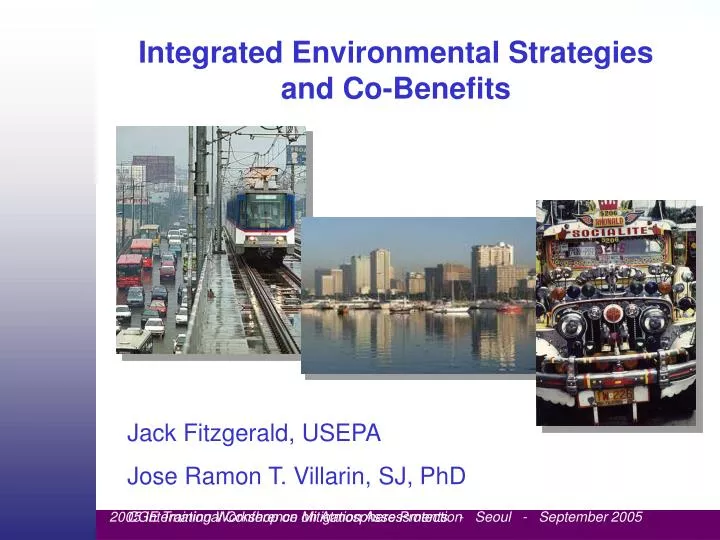
Integrated Environmental Strategies and Co-Benefits Jack Fitzgerald, USEPA Jose Ramon T. Villarin, SJ, PhD
Presentation Overview • Introduction to Co-benefits • Background on IES • Case Studies – Manila, Beijing and Santiago • Select Partner Achievements • Partner Support • Supporting the International Co-Benefits Community • Contact Information
Co-benefits: Why They Matter • Basic definition: All of the positive outcomes associated with multiple, simultaneous emissions reductions. • From a decision making perspective, co-benefits analysis allows energy options, health impacts, other policy goals, and GHG emissions to be linked together and evaluated. • Co-benefits analysis enables sound policy making to be based on quantitative analysis. • It helps prioritize options in an environment where resources are limited. • Supports mitigation analysis to inform environmental programming and decision making.
How Can Co-benefits Be Achieved? • Integrated measures that reduce GHG emissions and improve local air quality Integrated • Low-sulfur coal • Smokestack controls • Catalytic converters • Diesel particle traps • Evaporative controls • Clean fuels/renewables • Energy efficiency programs • Methane gas recovery • Fuel switching • Public transport and land use • Retirement of older vehicles • Efficiency standards for new vehicles/appliances • Inspection and maintenance programs Global • Geological and terrestrial sequestration • Land use and land use change • Control of other GHGs (CH4, N2O, HFCs, PFCs, SF6) Local Integrated Adapted from Jason West et al (2002)
IES: U.S. EPA’s Integrated Environmental Strategies Program • Established in 1998 as a capacity-enhancing co-benefits program. • Partners local teams in developing countries with experts and tools from U.S. EPA, other IES projects, and other organizations (e.g., U.S. AID, U.S. National Renewable Energy Laboratory). • Flexible, to address local air quality and public health needs of stakeholders in cities. • Identifies and analyzes integrated (i.e., air-quality improvement and greenhouse-gas mitigation) strategies and co-benefits.
IES Goals • Identify strategies that reduce GHG emissions and improve local air quality while meeting public health, economic development objectives. • Provide stakeholders with quantitative estimates of global and local co-benefits of policies and technologies. • Engage stakeholders to lay groundwork for implementation of cost-effective air quality management strategies. • Build analytical, institutional, and human capacity for multidisciplinary analysis of GHG mitigation, health, and environmental impacts of alternative strategies. • Transfer tools and methodologies for co-benefits analysis.
IES Partners Countries with IES projects:
How IES Works Energy Emissions Modeling Air Quality Modeling Health Effects Modeling Economic Valuation Modeling TOOLS Inform Policy Projected Annual Emissions Projected Ambient Concentration Projected Public Health Impacts OUTPUTS Projected Economic Benefits • Prepare baseline inventory to identify sources of AQ and GHG emissions. • Develop alternative, integrated scenarios of measures based on local objectives using energy/economic models. • Estimate concentrations of air pollution and exposure through AQ modeling. • Estimate air pollution public-health benefits. • Compare costs and benefits of alternative mitigation options and business-as-usual scenarios. • Present results and seek feedback from policymakers/ stakeholders, fostering support for implementation. • Integrate results into planning processes.
Integrated Environmental Strategies (Philippine Study)
Outline • Context and objective • Framework • Policy identification • Methodology • Results • Conclusions and recommendations
Context and objective • Context • 2003 Inventory: significant contribution of transport to AQ degradation • Transport: Fourfold increase past two decades (4.2 M vehicles) • Public health: bronchial disease on the rise • Objective • Assess and quantify impact of different mitigation policies and measures (transport sector) • Air pollution and GHG mitigation • Health and economic impact
Framework • Mitigation policy identification • Scenario development • Baseline development (BAU) • AQ pollutant and GHG reduction computation • Health benefit calculation • Scenario minus baseline • Exposure (response function) • Economic benefit computation • Policy prioritization
Policy identification • Transport demand management • Rail-based mass transit system • Bikeways • Motor Vehicle Inspection System (MVIS) • CNG-powered buses • CME for diesel-powered jeepneys • Two to four-stroke tricycles • Diesel traps
Policy identification • Combo1: all policies except railways and four-stroke conversion • Combo2: all except railways • Combo3: all including railways
Methodology • Scenario dev, example: • Policy: 4-Stroke conversion • Scenario: PM emission factor of tricycles was reduced to 1/5 of the emission factor of tricycles in the baseline scenario applied to all tricycles in all zones
Methodology • PM concentration calculation • Emissions inventory • Dispersion modeling • Health effects estimation • Risk as function of exposure-response, excess exposure, baseline mortality/morbidity rates • Avoided health cases (relative to baseline) • Economic valuation • Benefits transfer, direct cost (medical), indirect (lost work days)
Methodology Emissions (tons/year) Annual PM concentration (ug/m3)
Results • Scenario development • Baseline travel demand (2005)
Results • PM level calculation (mean annual concentration in Metro Manila, BAU and mitigation scenarios)
Results • Health impacts
Results • Economic costs • Dominance of averted deaths and chronic bronchitis (similar to Chile study)
Results • Co-benefits • PM mitigation tracks CO2 mitigation in all policy scenarios except for 4-stroke conversion and diesel particulate traps • Minimal impact (on both PM and CO2) of CNG and CME policies • Individually, MVIS and railways have largest impact on both PM and CO2 • Best is still combination of mitigation policies
Conclusion and recommendations • From health and economic standpoint, three priorities: • MVIS • four-stroke conversion • Metro railway system • Minimal impact of CNG, CME policies because of low target vehicle population • Significant CO2 impact from MVIS and TDM, but key dual impact (PM and CO2) from MVIS and Railway policies
Conclusions and recommendations • Abatement cost associated with mitigation policy still needs to be incorporated • Extend analysis beyond transport to include stationary or area sources of pollution • Extend assessment beyond Manila to other emerging cities such as Cebu, Baguio, Davao and scale up to national level • Data collection, model refinement
Case Study: Beijing, China • Integrated Measures • Developed from Beijing Olympic Air Quality Action Plan. • Include changing coal boilers to natural gas, improving residential lighting and A/C practices, LPG in taxis, expanding public transportation development and vehicular emission standards. • Co-Benefits Analysis • Compared business as usual scenario against scenarios with measures. Projected out 30 years. • Models used: • LEAP 2000 (energy), ISC (air pollution) , APHEBA (health benefits)
Stationary Source Fuel-Switching: Beijing, China • Stationary source fuel-switching policies in the Clean Energy Consumption scenario include: changing industrial coal-fired boilers to natural gas, LPG for cooking in rural residences, and expanded natural gas power in the electrical grid.
Case Study: Santiago, Chile • Integrated Measures • Developed from the Chilean National Environmental Commission’s Santiago Decontamination Plan. • Include changing diesel boilers to natural gas, improving energy efficiency of residential and commercial lighting, CNG in buses, and mandatory renovation of the ageing taxi cab fleet. • Co-Benefits Analysis • Compared business as usual scenario against climate policy scenario with integrated measures. Projected out 20 years. • Models used: • Eulerian Box Model (air pollution), APHEBA (health benefits)
Energy Efficiency in Santiago, Chile • By switching to more efficient technologies the Chile team realized significant reductions in all emissions (i.e., GHGs and air pollutants) from energy generation. • The Chile team found that of all the measures they analyzed, energy efficiency measures were the most cost-effective during peak hours of energy consumption for GHG and air pollutant emissions.
Santiago, Chile Comparison of the ranking of measures by their carbon abatement costs and their PM2.5 precursors abatement costs.
Select IES Partner Achievements • In-country teams have completed initial assessments in Argentina, Brazil, China, Chile, India, Mexico, the Philippines, and South Korea. Potential AQ, public health, and GHG reductions are significant. • Partners in Santiago, Shanghai, and Seoul used results and the IES approach in developing AQ management plans. • Beijing is using the IES approach to support their Olympics AQ planning process. • Chile used results to support successful application for GEF funds to implement measures. • Korea’s analysis showed that 71% of cost of reducing CO2 emissions by 10% in 2010 would be offset by health benefits from associated AQ improvements.
Partner Support • Air Pollution Health Benefits Assessment Model (APHEBA) users’ guide and training course. • Provides a resource for conducting health benefits assessments of changes in air pollution concentrations. • Training course and materials on health benefits analysis. • Provides basic information and training to country experts with conducting health benefits analysis as part of integrated environmental analysis projects. • “Reduced form” analytical tools and methodologies. • Supports analysis of air pollution and GHG mitigation co-benefits where local data for detailed analysis of air pollution public health benefits is lacking.
Supporting the International Co- Benefits Community • IES Web site launched Fall 2004 – features information on methodology, country profiles, final country reports and other documents, presentations and publications. Available at <http://www.epa.gov/ies> • The IES Handbook: A Resource Guide for Air Quality Planning – The Handbook is intended to serve as a resource to support the development of co-benefits analysis projects in developing countries. Available at <http://www.epa.gov/handbook.htm> or by request. • International version of manual for EPA’s Environmental Benefits Mapping and Analysis Program (BenMAP) software. • International Training Module for developing countries interested in performing co-benefits analysis with IES methodology.
Contact information Jack Fitzgerald U.S. Environmental Protection Agency Washington, DC fitzgerald.jack@epa.gov IES email box at ies@epa.gov IES Web site at http://www.epa.gov/ies/