Download
1 / 21
210 likes | 248 Views
This research analyzes the vulnerability of Jamaican communities to potential increases in dengue fever transmission and suggests effective mitigation strategies. It explores vulnerable areas, socioeconomic characteristics, associated factors, historic trends, and future projections.

E N D
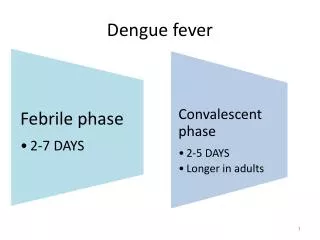
Vulnerability and Adaptation to Dengue Fever in Jamaica A Socioeconomic Scenario Charmaine Heslop-Thomas* and Wilma-Bailey
AIM To analyze the vulnerability of communities in Jamaica to possible increase in the transmission of dengue fever and to propose effective and feasible mitigating strategies.
RESEARCH QUESTIONS • What areas of the country are vulnerable to dengue fever? • What are the socioeconomic characteristics of the communities and groups that are vulnerable to dengue fever? • What are the socioeconomic factors associated with vulnerability? • What are the historic trends in these socioeconomic variables? • How might these variables change in the future?
VULNERABLE AREAS 1.Review present conditions in order to target vulnerable area: what areas are vulnerable to dengue fever? Obtained data from the Ministry of Health on the last two epidemics – 1995 and 1998. Difficulties experienced in assessing geographic distribution of dengue cases: -not all cases seen are reported to the MOH. When cases are reported, home addresses are not always recorded; in one of the largest outbreaks affecting the KMA in 1995, only the reporting hospital was recorded. Reported cases are those who were affected or who had developed complications. Unsatisfactory data made it difficult to come to grips with the geographic distribution of the disease – research not possible for all of Jamaica
Cont’d • In the absence of complete date we decided to see if data for any one year formed a recognizable spatial pattern. • We plotted the home addresses on a map and the only year in which we saw a recognizable trend was in 1998 in St. James. • In 1998 there were 224 reported cases in the island and 88 in St. James. • There were more males than females especially in the age group 20 -34 years.
Communities • Granville/ Pitfour is a suburb of the parish capital, Montego Bay. It has a population of 6359, slightly less than in 1991. Granville/Pitfour has an average of four persons per household but many of these households consist of one roomed informal as well as formal structures. Public standpipes and pipes in the yard together provide water to the majority of persons, pit latrines are most common. • Retirement is found immediately beyond the boundaries of the urban area. It has a population of 1783 and experienced slight growth between 1991 and 2001. Based on access to social amenities, Retirement is the best endowed of the three communities. • Johns Hall is in rural St. James and has a population of 2, 332-also showed a decline in population. A segment of the community resembles the squatter (informal) community of Granville/Pitfour. Many are not involved in typical rural pursuits.
Sample • 10 per cent sample of 257 heads of households. • 151-Granville/Pitfour • 57-Johns Hall • 49-Retirement
Vulnerability Framework • Adopted from Liverpool School of Tropical Medicine on vulnerability assessment for infectious disease-malaria, TB and HIV. • Proposal of vulnerability assessment at various scales-individual, household and community, environmental and institutional.
Framework for identifying factors that influence vulnerability to infectious diseases (LSTM)
Measuring Vulnerabilityof communities and groups • Questionnaire was used to establish vulnerability of communities and groups to dengue fever. • 257 questionnaires were administered to 257 heads of households in three communities –Granville/Pitfour, Retirement and John’s Hall. • Selection of indicators based on supporting literature. • Ranking of indicators
Identification of adaptive capacity at the Institutional Level • Interviews with experts from governmental and Non-governmental organizations. Mrs. Clarke –Allwood-Director, Programme, Budgeting and Financial Management Drs. Erica Edmann and Karen Webster-Medical Officers Mr. Peter Knight-Environmental Health Officer Mr. Desmond Clarke-Chief Public Health Inspector Mrs. Zoe Hamilton-Health Educator, Kingston and St. Andrew
Other Public Sector Institutions • Mr. Franklyn McDonald CEO, NEPA • Mr. Paul Saunders, Deputy Director General, ODPEM • Mr. Jeffery Spooner, Head of the Climate Branch, Meteorological Service of Jamaica.
Non-Governmental Organizations • Jamaica Environment Trust-Kerry Ann Curtis, Project Coordinator • Mr. Wellington Taylor, Jamaica Conservation and Development Trust • Professor Anthony Clayton-University of the West Indies Centre for Environment and Development • Professor Elizabeth Thomas- Hope, Environmental Management Unit, UWI
University of the West Indies Climate Studies Group, Mona • Professor Anthony Chen • Dr. Michael Taylor • Dr. Dharmaratne Amarakoon
Vulnerability at the institutional Level • Resource problem limits the ability of the MOH to respond adequately to present conditions. • No long term planning to meet the possibility of increased transmission. • Little routine surveillance but rather knee-jerk responses to outbreaks and citizen’s complaints. • Expressed view was that communities must take the responsibility for vector control
Vulnerability of Communities and Groups • Community vulnerability - vulnerability increased with increasing distance from the city of Montego Bay. - overall Johns Hall, the rural community was most vulnerable. • Vulnerable group -the most vulnerable group accounted for 14 per cent of the sample. -most were found in the rural community of Johns Hall (49 per cent) but the urban community of Granville/Pitfour accounted for 40 per cent. -this group consisted mainly of households headed by unskilled females who were earning below minimum wage
Future Trends • Historic trends and future projections. a. Examine the trends in socioeconomic variables associated with the most vulnerable community and groups over the past few decades. b. make projections based on these trends
Poverty • Declining trends over the past few decades but still not at an acceptable level.
Poverty cont’d • Urban and rural disparities in poverty