Download
1 / 3
40 likes | 211 Views
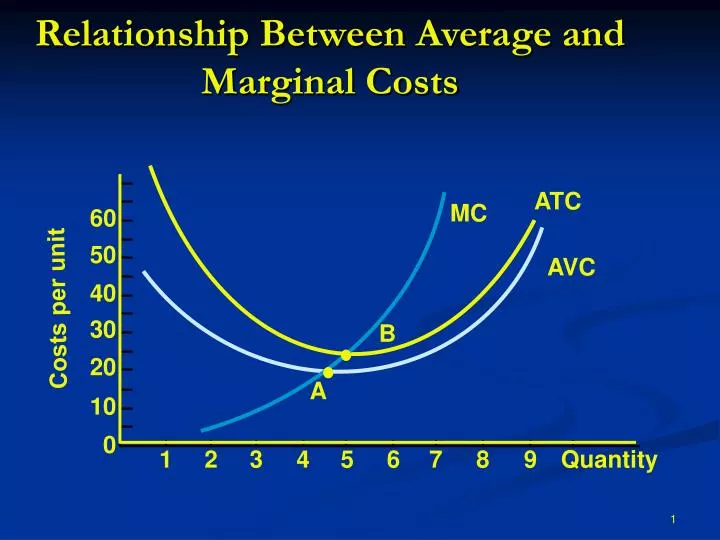
Relationship Between Average and Marginal Costs. ATC. MC. 60. 50. AVC. 40. Costs per unit. 30. B. 20. 10. A. Q 0. Q 1. 0. 1. 2. 3. 4. 5. 6. 7. 8. 9. Quantity. The U Shape of the Average and Marginal Cost Curves.

E N D
Relationship Between Average and Marginal Costs ATC MC 60 50 AVC 40 Costs per unit 30 B 20 10 A Q0 Q1 0 1 2 3 4 5 6 7 8 9 Quantity
The U Shape of the Average and Marginal Cost Curves • When output is increased in the short run, it can only be done by increasing the variable input. • The law of diminishing productivity causes marginal and average productivities to fall. • As average and marginal productivities fall, average and marginal costs rise.
MC AVC A AP of workers MP of workers 14 12 10 The Relationship Between Productivity and Costs Costs per unit 8 6 4 2 0 4 8 12 16 20 24 Output 7 6 5 Output per worker 4 3 2 1 Output 0 4 8 12 16 20 24