Download
1 / 27
270 likes | 414 Views
UTILIZATION OF CROP SENSORS TO DETECT COTTON GROWTH AND N NUTRITION. Tyson B. Raper , Jac J. Varco, Ken J. Hubbard, and Brennan C. Booker Plant and Soil Science Department Mississippi State University. INTRODUCTION. N in cotton production Recent increase in fertilizer costs

E N D
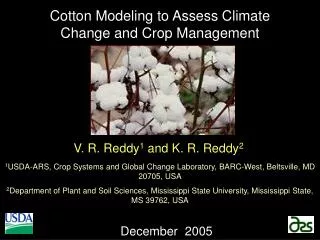
UTILIZATION OF CROP SENSORS TO DETECT COTTON GROWTH AND N NUTRITION Tyson B. Raper, Jac J. Varco, Ken J. Hubbard, and Brennan C. Booker Plant and Soil Science Department Mississippi State University
INTRODUCTION • N in cotton production • Recent increase in fertilizer costs • Deficiency limits yield and lowers quality • Excess N causes • rank growth • boll rot • difficulty in harvesting • increased need for growth regulators, insecticides, and defoliants • Variable Rate N • Increase Nitrogen Use Efficiency (NUE) • Decrease environmental pollution
INTRODUCTION • Ground-Based Sensors • Provide real-time cotton biomass and greenness • Fertilize response to crop reflectance • Need a more thorough understanding of relationship between canopy reflectance, cotton growth, and N nutrition.
OBJECTIVE • Examine the effectiveness of a ground-based sensor to predict cotton • Plant growth • Leaf N
METHODS • Location • Plant Science Research Farm, Mississippi State, MS • Randomized complete block design • 4 Treatments x 4 Replications • 12 rows • 125’ long • 3 10’ alleys • 38” row spacing • 4 sub-locations Courtesy: Web Soil Survey 2009
METHODS (CONT.) • Treatment • 0, 40, 80, and 120 lb N/acre in a split-application • Planting (50%) • Early square (50%) • Cultural • No-till on beds • DPL BG/RR 445 • No growth regulator applied • Low pest thresholds established and maintained
METHODS (CONT.) • Data Collection • Reflectance • YARA N Sensor (YARA International ASA, Oslo, Norway)
METHODS (CONT.) • YARA N Sensor • Tractor mounted spectrometer • Wavelength Channels: 5, user selectable* • Wavelength range: 450-900 nm • Optical inputs: 4 reflectance, 1 irradiance • Acquisition interval: 1 second • Area scanned: 50-100 m²/s • Positioning Data: Trimble Pro XR • Speed: 3.5 mph • Bandwidth= ±5 nm Source: YARA (Hydro Agri), tec5Hellma
METHODS (CONT.) • Data Collection • Reflectance (cont.) • YARA N Sensor • Set 76” above soil • Sense entire field • Views rows 2, 3, 4, 9, 10, 11 • Data Processing • Sub-plot locations • Center of 15’ buffer • 4 points selected
METHODS (CONT.) • Data Collection • Sub-Location Plant Data • Plant Height • 5 measured per sub-location • Leaf Sample • 5 recently matured per sub-location • % Leaf N • Whole Plant Sample • Prior to defoliation • Yield, total N uptake
Physiological Stages Pre-Square Early Square 2nd Week of Square 3rd Week of Square Early Flower 2nd Week of Flowering Peak flower METHODS (CONT.) Sensing / Sampling Stages
RED EDGE INFLECTION • First Derivative of Reflectance Signature
RED EDGE INFLECTION • REIP calculated on a per plot basis • Gaussian 4 Parameter Peak Equation • Utilize l • 700 • 710 • 720 • 740
CONCLUSIONS • GNDVI relationships with leaf N and plant height improve through to peak flower. • Consistency across growing seasons supports the utility of crop reflectance. • GNDVI and NDVI have the potential to be effective measurements of plant growth in cotton. • REIP has the potential to be an effective measurement of N status in cotton. • These results support previous REIP publications (Buscaglia et al., 2002; Fridgen et al., 2004).