Download

1 / 35
380 likes | 596 Views
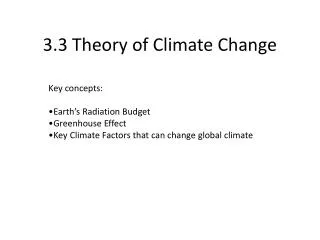
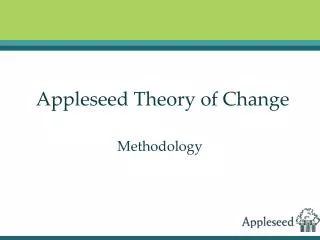
The Theory of No Change. Presentation IDEA Global Assembly 2013 Bridgetown, Barbados Dr. Christine Wörlen. Outline. The Climate- Eval community of practice The meta-evaluation on climate mitigation for the Climate- Eval community of practice The Theory of No Change Outlook.

E N D
The TheoryofNo Change Presentation IDEA Global Assembly 2013 Bridgetown, Barbados Dr. Christine Wörlen
Outline The Climate-Eval community of practice The meta-evaluation on climate mitigation for the Climate-Eval community of practice The Theory of No Change Outlook
Community of PracticeClimate-Eval (I) members Registered Members: 1,500 from National Government Agencies, Project Management Units, Think-Tanks, Development Organizations, Consulting Firms and Academia. Geographical Distribution Western Europe/Central Asia: 35%; Americas and Caribbean: 32%; East/South Asia & Pacific: 16%; Sub-Saharan Africa: 14%; Middle East and North Africa: 3%; Partnerships IDEAS – Climate Change Group ITIG Sea Change – South Asia Community of Practice IPEN – International Program Evaluation Network – Central Asia and former Soviet Union countries
Community of PracticeClimate-Eval (II) Resources Electronic library with more than 500 studies on Climate Change, Adaptation and Mitigation. Products Guidelines for Mitigation Evaluations Best Practices for Indicators on Adaptation Meta-Evaluation of Mitigation Evaluations Study of Frameworks for Adaptation Promotion and Engagement Monthly Webinars and Newsletters Weekly Blogs Post Attendance of meetings and Conferences
Community of PracticeClimate-Eval (III) Please Join! It is easy: • linked-in Group Climate-Eval: Evaluation of Climate Change and Development • Sign- up on website climate-eval.org to receive emails • Submit studies, requests and other contributions
Analytical workoftheClimate-Eval Community of Practice: The Mitigation Meta-Evaluation
Meta-Evaluation forarrivingattheTheoryofNo Change • Startingpoint: evaluationframeworkofTokleand Uitto (2009) • Evolution intostakeholder / barriermodel • Analysis oftwo sectoral transformationprocesses • Energy efficiencyproducts (light bulbs, refrigerators) in Thailand • DistrictHeating in Poland • eachover 2 decades, • Based on evaluations • Leads to definitionofbarrierframework / TheoryofNo Change andtwovisualizationtools
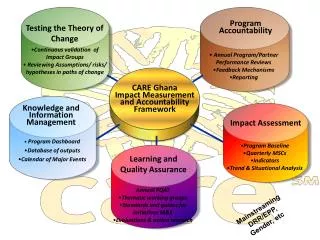
Evaluation Framework (TokleandUitto (2009)) Evaluation framework GHG emissions reduction or avoidance Impacts RESULTS Sustainable market transformation for increased energy savings or applications of renewable energy Outcomes Enabling policies, strategies, standards and certification in place Adequate finance available Adequate business infrastructure Awareness created Innovation and technology diffused Financial sector Financial sector Supply chain and infrastructure Develop enabling policies standards and certification Develop financing instruments and mechanisms Develop business models and provide enterprise support Develop and disseminate Information and knowledge Demonstrate creative project approaches and technologies Consumers Policy makers Consumters PERFORMANCE Strategies
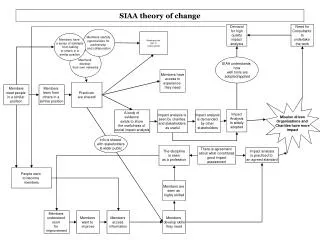
Stakeholder and potential barriers to market transformation – whyarethings NOT changing? • Lack of awareness of energy efficient technology (ignorance) • Lack of technical competence (expertise) • Lack of access to technology for manufacturing or distribution • Lack of business model • Lack of cost effectiveness • Lack of working capital (affordability) • Lack of awareness of energy efficient technology (ignorance) • Lack of motivation / interest • Lack of technical competence (expertise) • Lack of access to technology • Lack of cost effectiveness • Lack of investment capital (affordability) Market Transformation GHG redu +econ. benefit • Lack of motivation / interest • Lack of awareness of energy efficient technology (ignorance) • Lack of technical competence (expertise) for designing effective policies • Lack of fiscal means (affordability) • Lack of technical competence for evaluating technology (expertise) • Lack of business model (risk) • Lack of cost effectiveness • Lack of liquidity (affordability)
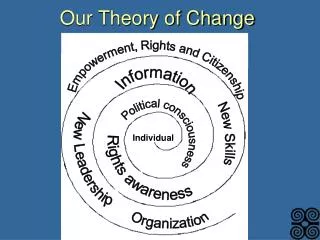
“Barrier Circle” – or “why things are NOT changing” Red: “This barrier is a show-stopper for the market.” Orange: “This is a significant barrier.” Yellow: “Not a good situation, but no significant challenge.” Green: “This potential barrier is not impeding market development.”
Project strategies can be aligned with the respective barriers.
An Example for Thailand Replacing T12 tubes by T8 tubes Replacing light bulbs with energy savings bulbs (compact fluorescent lamps, CFLs) Replacing inefficient building chillers (large AC units) in commercial and industrial buildings with efficient building chillers.
WB DSM + GTZ project activities for T8 light tubes(Na Phuket, Sulyma, WB)
Framework TheoryofNo Change forclimatemitigation –Whatisitgoodfor? Enhanced explanatory power by: • Compilingevidencefrom a large sample orcases • Startingpoint: „What was missing?“ Leads to: • Betterunderstandingoftheevaluandumanditscontext • More clarity on whatworksandwhatdoes not andwhy • Solveattributabilityquestionfor „partial“ interventions („logicalgap“) • Solvecontextquestions • Help identifylessonsforbetterprojects Can behelpful in evaluationaswellasproject/programmplanning.
Conclusions / Observations TONC can serveforformulationofhypotheses to understandfailureoradjustment potential ofinterventionsandapproaches. Barriersseemrather robust („theydo not knowtheoption, theyhavenoaccess to theoption, theydon‘twantto usetheoption, theoptionistooexpensive“). Small adjustmentsregardingthestakeholdersneed to bemadewhentransferringbetweensituations Behavior / Barriersforonegroupofstakeholdersmightdepend on behavior / barriersofothergroupsofstakeholders. Barriersare not alwaysindependentbetweengroups.
TONC as a methodologyforunderstandingcontext TheoryofNo Changecan beabstractedfromthefieldofclimatemitigationandapplied to otherfields. Generally, thefollowingstepsarerequired: Identifythebehaviorthatleads to thedesiredoutcome („get sick less“, „get smart“) – playaroundwiththedefinitionoftheoutcome, andthedefinitionofthe „user/consumer“ Identify, whytheuser/consumerdoes not exhibitthedesiredbehavior; usethe 7 barriersas a start (carefully: not toomuchdetail), identifythestakeholders Analyzewhetheror not stakeholdersfacebarriers to allowfordesiredbehaviour.
Thank you for your attention. Further Questions? www.climate-eval.org Climate-eval@climate-eval.org Christine Wörlen, woerlen(at)arepo-consult.com
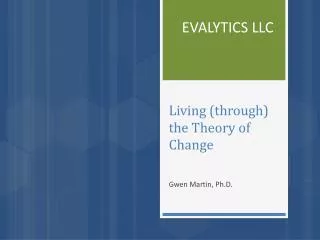
Alternative display: comptable Color codeallows to compareseveralprojects in tables Here: casestudyPolanddistrictheating
Examplesforclimatemitigation „projects“ Installation of a wind turbine Assessment of wind power generation potential Policyschemefor solar systems Training fortechniciansforhomeinsulation / weatherization Energy audits New refrigerator Technical standards/lawsrequiringwasterecycling in factories A campaignforusingbicyclesinsteadofcars Capturinganddisposingofcarbondioxideemissions (CCS) ….
Testing the TONC: Market Transformation through Demand Side Management in Thailand since 1992 • Thai economy: 10.6% annual growth between 1986 and 1995 • Energy demand increased in step • In 1992: Energy Conservation Law with obligatory energy reporting for large consumers and other (softer) measures. • The national energy utility EGAT started • We look at 2 cases: • energy efficient lighting in households and • energy efficiency in industrial and commercial facilities • Crises: • Thai / Asian Financial Crisis in 1997 • Privatization of EGAT in 2000-2002 • Test Question: can the model reflect market transformation successes and failures?
Interim test result Tool can reflect changes in market barriers and barrier removal strategies Easy to handle It becomes clear that every “market” (in the sense of a GHG emission reducing activity) needs its own set of analyses as the barriers are not of the same strength Currently only qualitative analysis possible – more standardization needed for it to have more predictive power
Tool Facilitates a moreholisticanalysis – oftentheprojectitself was successfullyimplemented (outputs, outcomes) but not able to lead to impacts, maybe due to otherbarriers Can illustratewhat was missing Can helpguidefutureproject design And ex-ante evaluation (istheprojectdesigned to matchthebarrierstructure) Can illustrateifprogramcomponentsaresuperfluous Can helpcompareprograms, approachesandevenareasforintervention
Alternative display: comptable Color codeallows to compareseveralprojects in tables Here: casestudyPolanddistrictheating
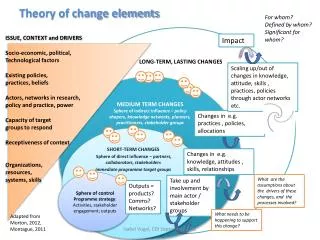
Keep developingthis Framework Theoryof Changeso thatit will beableto : • Reproduce „complete“ theoryofchange – not just thegroups / capacities / factors / aspectsthatarethesubjectoftheproject • Reflect sectoral context in a complete but „lean“ manner • Reflect relative importanceofimpeding / supportivefactorsforinterventionresults • Allowforthedevelopmentof (outcome) indicatorsacrossstakeholdersandinterventionsand GHG savingspotentials • Be flexible andrigorousatthe same time
Useof TONC in project design TheoryofNo Change: Analyzingbarriershelps find out wherethenextproject can push theenvelope, cost-effectively(ClimateWorks evaluation, GEF EO impactstudy); itlooksacross different stakeholdergroups UseofToolforcomparing different projects can helptransferlessonslearned / usefulprojectapproaches / bestpracticesfromoneprojectotanother. UseofComparison Table allowsforchoiceofmostappropriate alternative behavior to beimplemented in nextproject. Overall, thisanalysistellsyouwhat to do next.