Download
1 / 23
260 likes | 301 Views
This bioinformatics analysis pipeline explores the viral fraction of the human microbiome, particularly the virome, to uncover potential associations with diseases like cancer. Learn about library preparation, de novo assembly, challenges, and k-mer normalization techniques in viral metagenomics. Discover the impact of viruses on human health through advanced data analysis methods.

E N D
Bioinformatics analysis pipeline forviral metagenomics Davit Bzhalava, PhD Dept. of Laboratory Medicine, KarolinskaInstitutet, Sweden Davit Bzhalava
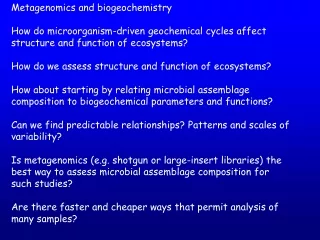
Human Microbiota Davit Bzhalava We are born 100% human and we die 90% microbial. The term human microbiome or microbiota, defines the collection of microorganisms that reside in the human body. The viral fraction of human microbiome is referred to as the human virome. Viruses constitute only a small part of human microbiota, but their proportion and composition seems to change in diseased individuals.
Tumor Viruses Davit Bzhalava • 2 million (16%) of new cancer cases worldwide was estimated to be attributable to infections in 2008. • 1300000 (65%) of these cancers were attributable to viral infections • There is epidemiological indication that additional cancer-associated viruses may exist: • Increased incidence of some cancer types among immunosuppressed individuals; • Space and time clustering of childhood leukemias.
Purpose of viral metagenomics Davit Bzhalava Who is there? What are they doing? How are they doing it?
Needle in a haystack Davit Bzhalava Viruses usually constitute <0.1% of the whole metagenomic datasets Small changes in the data analysis pipeline can drastically alter results
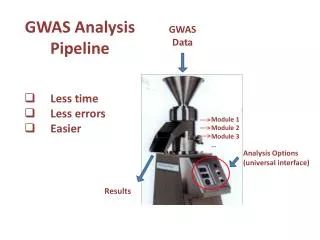
Library Preparation Sequencing Data Analysis Bioinformatics Pipeline Filter out Human, bacterial, phage and vector sequences Normalize k-mer frequencies Genome assembly Assembly validation & number of reads estimation Taxonomic classification Final characterization of virus related sequences Case-control comparison of virus related & “unknown” sequences / OR estimation Davit Bzhalava
Library Preparation Sequencing Data Analysis Bioinformatics Pipeline Filter out Human, bacterial, phage and vector sequences Normalize k-mer frequencies Genome assembly Assembly validation & number of reads estimation Taxonomic classification Final characterization of virus related sequences Case-control comparison of virus related & “unknown” sequences / OR estimation Davit Bzhalava
de novo assembly • NGS technologies produce billions of short reads from random locations in the genome by oversampling it. • Assembly algorithms, in the process called de novo assembly, reconstruct original genomes present in the sample by merging short genomic fragments into longer contiguous sequences (“contigs”). • There are two main types of de novo assembly programs: • Overlap/Layout/Consensus (OLC) assemblers • de Bruijn Graph Assemblers Davit Bzhalava
OLC assembly Overlap: find potentially overlapping reads Layout: merge reads into contigs and contigs into supercontigs Consensus: derive the DNA sequence and correct read errors ..ACGATTACAATAGGTT.. Davit Bzhalava
de Bruijngraph assembly • de Bruijngraph assemblers model the relationship between exact substrings of length k extracted from the input reads. • In de Bruijngraph the reads themselves are not directly modelled but they are implicitly represented as paths through the de Bruijn graph. • Most de Bruijn graph assemblers use the read information to refine the graph structure and to remove graph patterns that are not consistent with the reads. • de Bruijn graph approach is based on exact matches, thus error correction approaches (used both before and during assembly) are crucial for achieving high-quality assemblies. Davit Bzhalava
Challenges in assembly Davit Bzhalava • If we have 2 sequences • the_quick_brown_fox_jumps • jumps_over_the_lazy_dog • Will be decomposed into k-mers • Kmer = 5 • put both sentences into the same graph and follow the links in the graph • the_q-> he_qu -> e_qui -> _quic -> quick -> uick_ -> ick_b -> ck_br • to spell out the 'assembled' sentence, • the_quick_brown_fox_jumps_over_the_lazy_dog • If kmer= 6: there's no 6-mer word that is in common between the sentence fragments. • If k-mer = 4, the graph becomes complicated: the word the_ appears twice ***Example taken from: http://ivory.idyll.org/blog/the-k-parameter.html
Challenges in assembly Davit Bzhalava • Solution is to try as many assemblers and with as many parameters as possible. • Resources including time is limited • Assemblies are RAM thirsty • NextSeq, 300m reads ≈250GB RAM • kmer based assemblers scale poorly
Library Preparation Sequencing Data Analysis Bioinformatics Pipeline Filter out Human, bacterial, phage and vector sequences Normalize k-mer frequencies Genome assembly Assembly validation & number of reads estimation Taxonomic classification Final characterization of virus related sequences Case-control comparison of virus related & “unknown” sequences / OR estimation Davit Bzhalava
K-mer normalization Number of reads before normalization 1’642’160’122 paired reads Davit Bzhalava
Number of reads after normalization 282’961’022 paired reads (17% of initial reads) Davit Bzhalava
Human genome coverage before normalization Davit Bzhalava
Human genome coverage after normalization Davit Bzhalava
Number of reads after HG clean up 6’745’443 paired reads (0.02 % normalized data and 0.004% of initial reads) Davit Bzhalava
Library Preparation Sequencing Data Analysis Bioinformatics Pipeline Filter out Human, bacterial, phage and vector sequences Normalize k-mer frequencies Genome assembly Assembly validation & number of reads estimation Taxonomic classification Final characterization of virus related sequences Case-control comparison of virus related & “unknown” sequences / OR estimation Davit Bzhalava
Taxonomic classification Davit Bzhalava NCBI BLAST - One of the most famous similarity-based taxonomic classification NCBI BLAST compares sequences to known genomes
Challenges in taxonomic classification http://www.ncbi.nlm.nih.gov/genbank/statistics AccessedonNov 08, 2015 Davit Bzhalava Genome sequencing has led to massive data generation requiring a significant increase in the speed of execution of these algorithms. Necessity to search new and ever expanding databases
Challenges in taxonomic classification Davit Bzhalava • NCBI BLAST-based search tools • are extremely time consuming • may take days or even weeks to complete when large metagenomic datasets need to be compared against nucleotide or protein databases • Paracel Blast a commercial software • Achieved the same results, on same file, on same machine 10 times faster • Scalable open source NCBI BLAST solutions are needed
Thank you! Davit Bzhalava