Download
1 / 22
220 likes | 377 Views
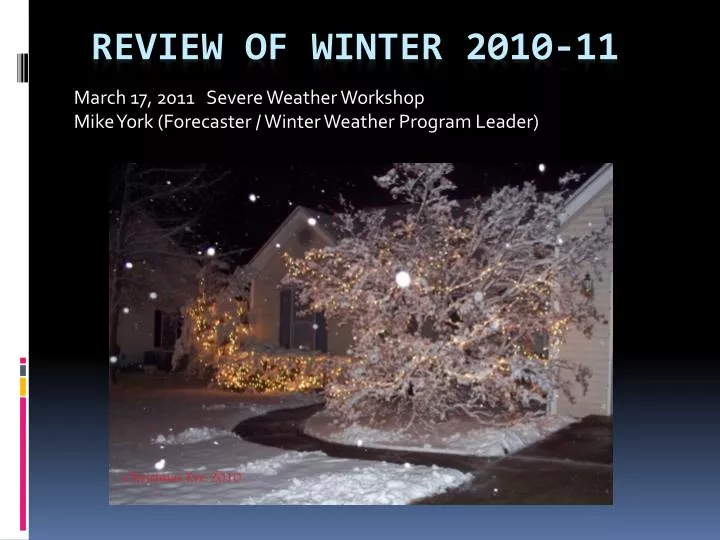
March 17, 2011 Severe Weather Workshop Mike York (Forecaster / Winter Weather Program Leader). review of winter 2010-11. How did we do?. Preliminary Verification Statistics: Very good, but is that the whole story?. Issued 70 county Winter Storm Warnings False Alarm Ratio: 26 percent

E N D
March 17, 2011 Severe Weather Workshop Mike York (Forecaster / Winter Weather Program Leader) review of winter 2010-11
How did we do? • Preliminary Verification Statistics: Very good, but is that the whole story? • Issued 70 county Winter Storm Warnings • False Alarm Ratio: 26 percent • Probability of Detection: 80 percent • Average Lead Time: 5.1 hours
Stats compared to average of past several seasons: • Average number of warnings: 70 vs. 177 • Average false alarm ratio: .26 vs. .33 • Average prob. of detection: .80 vs. .88 • Average lead time: 5.1 hrs vs. 21 hrs
What is lead time? • The time between warning issuance time and the time 4” is on the ground • Lead times are not computed for watches.
Why the short lead times? • Snow amounts were under forecast until the storm was in progress. • Why?
After the 4th under forecast snow event, the boss was not happy. • Science team tasked with investigating why • Preliminary results still not complete • What we do know… will follow shortly
Four events under review: • Dec. 24 (Christmas Eve – Paducah area) • Jan. 25 (Pennyrile region) • Feb. 7 (Western Kentucky) • Feb. 9 (Tennessee border)
Dec. 24… • Heavy snowfall rates for a few hours after dark • Around 1” per hour • Total was around 4” in Paducah and nearby areas
Dec. 24 Preliminary Findings • “Split flow” pattern: Moist southern branch of the jet played a greater role than expected • Band of moisture/heavy snow streamed northeast faster than expected • Warm pavement temps were a non-factor due to heavy snowfall rates
Jan. 25-26 Prelim. Findings • 48-72 hours in advance: All models showed system bypassing region to the south • Models then trended slowly north • Within 12 hours, NAM and RUC caught onto a deformation zone but missed the location
Feb. 7 preliminary findings • Deformation zone played a key role in heavy snow • Models began picking up on this zone about 12 hours prior • Warm pavement temps again a non-factor
Feb. 9 preliminary findings • 30-48 hours prior, forecasters suspected models were too weak based on 2/7 system • Liquid to snow ratios were a concern (dry and powdery vs. wet and heavy) • Banding was not anticipated
Common thread: • Mesoscale bands of heavy snowfall • Bands from 4 to 40 miles wide • Sometimes accompanied by thunder
Mesoscale Bands: • Difficult to forecast because of their size • Computer models cannot explicitly forecast these bands • Conditions favorable for banded snowfall can be forecast • BUT not precisely!
Forecaster options: • At longer time ranges, use the caveat “locally higher amounts possible” • At shorter time ranges, satellite imagery is an excellent tool for first identification Feb. 5, 2004 Near Paducah, KY NWS Photo – Mike York
Common threads of these events: • Computer models under forecast precipitation amounts • Unforecast “deformation zones” caused intense snowfall rates • Warm pavement temperatures
What next?: • Science team is looking at snow to liquid ratios (dry snow vs. heavy wet snow) • Science team is looking at what role banding played and how to anticipate it
Summary: • We are still researching “what went wrong” • More than one factor played a role • Computer model limitations were one factor • Forecaster ability to troubleshoot the models may be a factor • Forecasting snow to liquid ratios may be a factor