Download

1 / 21
210 likes | 336 Views
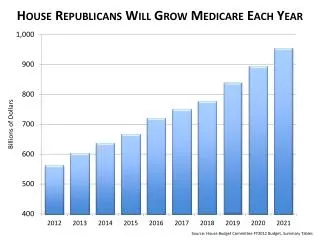
FY2012 Budget. Five Year Budget History. 2008 - $300 million. 2009 - $327 million. 2010 - $317 million. 2011 - $284 million. 2012 - $296 million. Significant Challenges. State Funding - Austerity Reductions (10 Years) . Local Tax Digest . Loss of Federal Stimulus Dollars.

E N D
Five Year Budget History • 2008 - $300 million • 2009 - $327 million • 2010 - $317 million • 2011 - $284 million • 2012 - $296 million
Significant Challenges • State Funding - Austerity Reductions (10 Years) • Local Tax Digest • Loss of Federal Stimulus Dollars • Millage Rate(20 mill cap) • Transportation Funding • State Funding Formula Does Not Fund • Technology (K – 12)
State Austerity Reductions Total: $ 126,984,020
Millage Rate Information Property Taxes are levied on real and personal property. Based on values as of January 1 each year, taxes are levied using a “millage rate” which taxes citizens based on $1 per $1,000 of assessed property value.
Pupil Transportation Revenue/Expenditures Expenditures State Funding
Operating Revenue / Expense • Revenue $287,034,597 • Expense $296,488,907 • Reserves $ 9,454,310
Revenue Assumptions • 6.5% decrease in local tax digest ($7.8 million) • 92% tax collection rate • State austerity reduction FY2012 ($29 million) • ARRA funding not available • State Education Equalization Grant $17 million (FY11 was $12 million)
Where The Money Comes From FY2012 Budget • Local Sources $ 103,348,502 Includes Property Taxes, Real Estate Transfers, Alcohol Beverage Taxes, Interest Earnings, Miscellaneous Fees • State Sources $ 180,892,607 Quality Basic Education Funding (QBE) & Miscellaneous Grants • Federal Sources $ 2,793,488 ROTC Instruction Salary Reimbursements, Medicaid Reimbursement, E-Rate Reimbursement $ 287,034,597
Expenditure Assumptions • 3 furlough days for most categories of employees • 5 furlough days for administrators • Freeze salaries for all employees • State Health Insurance – employer rate 18.534% • Special Education ARRA Positions: 28 Teachers/69 Paras • Increased Staffing : 11 Teachers – Special Education : 11 Paras – Special Education : 4 Teachers – Regular Education • Reduce Assistant Principal Allocations (3 positions) • Warehouse • Fuel $2.2 million • Blackboard Connect Ed
Cost per Student Comparison FY10 Cost Per Student Comparison (10 Largest Districts) Source: GDOE – Financial Data Collection System.
Per Student ExpenditureFY2012 40,290 Students $7,358 (FY11 $6,968) Note: Amount represents annual operating expenses only.
Salaries and Benefits $9 million $7 million $6 million Total Salaries / Benefits $265 million $243 million
Salary Schedule Recommendations • All employees will move up on the appropriate salary schedule for an earned experiencestep. • Salary schedules will shift so that step reflects no increase – salaries will be frozen. • Net result: employees will receive the same pay as they are receiving in current year if they are employed in the same position as current year.
General Administration Expenditures Source: Financial Data collection system http://app.doe.k12.ga.us Note: Rank is based on #1 spending least amount per student (180 districts reporting)
Summary • Mission Statement –Direct Instruction Budget 71% • State Austerity Reduction ($29 million) • Tax Digest Decrease 6.5% ($7.8 million) • Balanced Budget with Cash Reserves ($9.4 million) • 90% Budget Employee Salaries/Benefits • Furlough Days = $3.7 million • FY2013 & FY2014 Financial Outlook