Download
1 / 12
120 likes | 231 Views
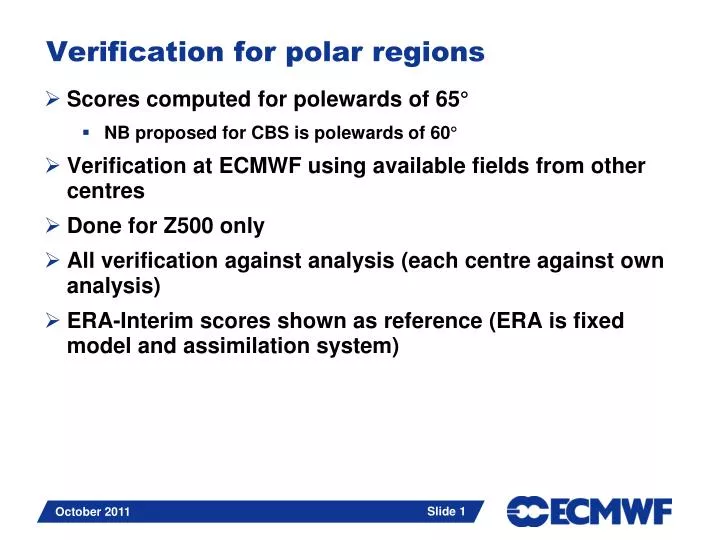
Verification for polar regions. Scores computed for polewards of 65° NB proposed for CBS is polewards of 60° Verification at ECMWF using available fields from other centres Done for Z500 only All verification against analysis (each centre against own analysis)

E N D
Verification for polar regions • Scores computed for polewards of 65° • NB proposed for CBS is polewards of 60° • Verification at ECMWF using available fields from other centres • Done for Z500 only • All verification against analysis (each centre against own analysis) • ERA-Interim scores shown as reference (ERA is fixed model and assimilation system) October 2011
ECMWF operational and ERA-Interim (1990-2011) • Z500 ACC=80%, 12-month moving average • N Pole: clear improvement in system around 2000, and consistently better than ERA beyond 2002. But the apparent change 2001-2002 and 2008-09 are matched in ERA • S Pole: clear sustained improvement in 1990s; still positive trend • ERA changes: either atmospheric variability or changes to observing system N Pole S Pole October 2011
Comparison with other centres (2000-2011) N pole • Day 3 forecasts (T+72) • Z500, 12-month moving average • Each centre verified against own analysis • ERA-I shown for reference rms error ACC October 2011
Comparison with other centres (2000-2011) S pole • Day 3 forecasts (T+72) • Z500, 12-month moving average • Each centre verified against own analysis • ERA-I shown for reference rms error ACC October 2011
Comparison with other centres (2000-2011) N pole • Day 5 forecasts (T+120) • Z500, 12-month moving average • Each centre verified against own analysis • ERA-I shown for reference rms error ACC October 2011
Comparison with other centres (2000-2011) S pole • Day 5 forecasts (T+120) • Z500, 12-month moving average • Each centre verified against own analysis • ERA-I shown for reference • NB some dates missing for CMC in 2009 – affects these scores for 2009 (other years OK) rms error ACC October 2011
Comparison with other centres (2000-2011) N pole • Variability (activity) of forecast and analysis fields: standard deviation of anomalies • Day 5 forecasts (T+120) • Z500, 12-month moving average • ERA-I shown for reference • Compared to the analysis, Met Office forecast now rather underactive; CMC overactive (this can affect the rms errors) • NB some dates missing for CMC in 2009 – affects these scores for 2009 (other years OK) analysis forecast October 2011
Comparison between analyses (N Pole) • Differences between the analyses of different centres • Z500 30 day moving average • Decrease over last decade in the difference between the analyses of different centres rms difference mean difference October 2011
Comparison between analyses (S Pole) • Differences between the analyses of different centres • Z500 30 day moving average • Decrease over last decade in the difference between the analyses of different centres rms difference mean difference October 2011
Comparison with other centres (JJA 2011) arctic • Mean scores over 3 months (June, July, August 2011) • Includes JMA • This for polewards of 60° (the new proposed CBS area) • All centres have slightly lower rmse and higher ACC for this larger area • In winter (DJF) it is opposite (error larger in the larger area, consistent with higher average activity towards mid-latitudes) • The definition of the area does not affect the relative performance of the different models October 2011
Comparison with other centres (JJA 2011) N pole • Mean scores over 3 months (June, July, August 2011) • Includes JMA • This for polewards of 65° (for comparison with previous slide) October 2011
Comparison with other centres (JJA 2011) antarctic • Mean scores over 3 months (June, July, August 2011) • Includes JMA • This for polewards of 60° (the new proposed CBS area) October 2011