Download
1 / 10
100 likes | 237 Views
Marginal Generation Costs. PG&E Model . Thursday, April 19, 2012. Agenda. Portfolio Modification. PG&E will present : Refresh on PG&E’s internal model Differences of PG&E’s model with the CPUC’s E3 Model

E N D
Marginal Generation Costs PG&E Model Thursday, April 19, 2012
Agenda Portfolio Modification • PG&E will present : • Refresh on PG&E’s internal model • Differences of PG&E’s model with the CPUC’s E3 Model • Results using PG&E’s internal model but with inputs based on publicly available data rather than PG&E’s confidential data.
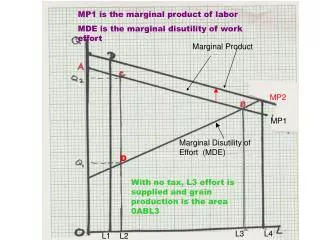
PG&E’s Avoided Capacity Cost Model (1) • Balance year: the year in which there is insufficient existing resources to meet capacity requirements • Marginal Capacity Cost each year calculated based on • Net capacity cost of an new unit on and after the Balance Year, • net capacity cost of an existing unit prior to the Balance Year, and • Which new unit sets the margin? • Either CT or CC, whichever has the lower net capacity cost for the year • Which existing unit sets the margin? • Either CT, CC, or ST, whichever has the highest net capacity cost of the marginal unit meeting capacity requirements for the year Portfolio Modification
PG&E’s Avoided Capacity Cost Model (2) • PG&E Calculates Net Capacity Cost for year k for a new unit as: • The fixed real annual payments for a unit that comes online in year k that when escalated at the inflation rate are sufficient for investors to recover the return on investment that they do not recover from selling energy over the life of the unit • Specifically, Net Capacity Cost is NCC in the following formula: • Levelized After-tax inflation-adjusted NCC = • Levelized After-tax Fixed Cost - Levelized After-tax Energy Gross Margin • Where • After-tax Fixed Cost = Initial Equity Investment • + After-tax [Insurance + Property Tax + Fixed O&M ] • + Debt Principal Payments + After-tax Debt Interest Payments • - Depreciation Tax Deduction • * Levelization and present value is done using the “real cost of equity” rate. Portfolio Modification
PG&E’s Avoided Capacity Cost Model (3) • PG&E Calculates Net Capacity Cost for year k for an existing unit as: • The going-forward fixed cost of an existing unit that cannot be recovered from selling energy over the year, assuming the plant was fully depreciated. • Specifically, Net Capacity Cost is NCC in the following formula: • NCC = MAX( Fixed Cost - Energy Gross Margin, 0) • Where • Fixed Cost = Insurance + Property Tax + Fixed O&M Portfolio Modification
Difference with the E3 Model (1) • E3 Calculates Net Capacity Cost for year k for a new unit as: • The fixed real annual payments for a unit that comes online in year k that when escalated at the inflation rate are sufficient for investors to recover the return on investment, less energy margin that a unit can earn in year k • Specifically, Net Capacity Cost is NCC in the following formula: • NCC = Annualized Fixed Cost - Energy Gross Margin • Where • Annualized Fixed Cost is X in the following formula: • Levelized After-tax inflation-adjusted X = Levelized After-tax Fixed Cost • Where • After-tax Fixed Cost = Initial Equity Investment • + After-tax [Insurance + Property Tax + Fixed O&M ] • + Debt Principal Payments + After-tax Debt Interest Payments • - Depreciation Tax Deduction • * Levelization and present value is done using the “cost of equity” rate. Portfolio Modification
Difference with the E3 Model (2) • E3 Model does not calculate the Net Capacity Cost for existing units. • E3 Model assumes $28.07/kw-yr for 2008 and take the linear interpolation from 2008 to the Net Capacity Cost for the Balance Year • There are methodological differences on energy margin calculation • PG&E: Based on the forward price curves, volatilities and correlations • E3: Based on historical heat rate and gas price forecast Portfolio Modification
Year NewCT NewCCGT ExistingSU ExistingCT ExistingCC 2014 $122 $97 $4 $9 $0 2015 $124 $97 $4 $8 $0 2016 $125 $97 $3 $8 $0 2017 $127 $97 $2 $7 $0 2018 $128 $97 $2 $7 $0 2019 $130 $97 $1 $6 $0 Year NewCT NewCCGT ExistingSU ExistingCT ExistingCC 2014 $150 $114 $21 $29 $13 2015 $153 $114 $21 $29 $13 2016 $156 $114 $21 $29 $12 2017 $159 $114 $22 $30 $11 2018 $162 $114 $22 $30 $10 2019 $165 $114 $22 $30 $9 Results from PG&E Model using E3 price data • When using the price data in E3 in the PG&E Model, the results are as follows: • Using Real-time Prices • Using Day-ahead Prices Portfolio Modification
Results from PG&E Model using E3 price data • Compared with PG&E’s Model using PG&E’s confidential price data, • Using real-time price data and gas price forecast in E3 model provides much lower MGCC • Using day-ahead price data and gas price forecast in E3 model provides a similar value for MGCC • E3 Model has much higher estimate for MGCC due toits Balance Year Assumption and the Transition Method. Portfolio Modification
Results from PG&E Model using E3 price data (New Units) • When using the same inputs, the two models result in similar estimates for the net capacity cost for new CT. Portfolio Modification