Download
1 / 20
200 likes | 351 Views
Marginal Generation Costs. Illustrative Results Based on E3’s Avoided Cost Model. Thursday, April 19, 2012. Background. Portfolio Modification.

E N D
Marginal Generation Costs Illustrative Results Based on E3’s Avoided Cost Model Thursday, April 19, 2012
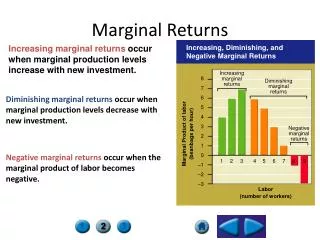
Background Portfolio Modification • PG&E's 2011 GRC Phase 2 settlement, D.11-12-053, adopted December 15, 2011, calls for a workshop prior to May 1, 2012, to identify and discuss publicly available models and data bases covering generation marginal costs. • PG&E’s marginal generation costs are for retail rate design and allocating revenue requirements among PG&E’s bundled electric customer classes to reflect cost causation and promote economic efficiency. • Marginal generation costs are estimates of the changes in PG&E’s electric procurement costs caused by small changes in customers’ energy usage and peak demand and do not reflect PG&E’s actual electric procurement costs.
Marginal Generation Costs Components Portfolio Modification • Marginal Energy Cost (MEC) • ¢/kWh. • Average forecast hourly power price for northern California, January 1, 2014 through December 31, 2014. • For five time of use (TOU) rate periods and three voltage levels. • Marginal Generation Capacity Cost(MGCC) • $/kW-year. • Marginal generation resource’s residual capacity value—going-forward fixed costs minus market revenues—levelized over six year period, January 1, 2014 through December 31, 2019. • For three voltage levels.
Public Source of Data and Calculation Portfolio Modification • Avoided cost model created by Energy and Environmental Economics Inc. (E3) for the CPUC. • In response to Administrative Law Judge Farrar’s October 5, 2011 “Administrative Law Judge’s Ruling on Updates and Adjustments to Energy Efficiency Avoided Cost Inputs and Methodology” in Rulemaking R.09-11-014. • E3’s Distributed Electric Resources Avoided Cost Model, version 3.9: http://www.ethree.com/documents/E3%20Calculator%2009.20.11/DERAvoidedCostModel_v3.9_2011%20v4b%20CA%20Avg.zip
Marginal Cost Changes from 2011 GRC Phase 2 Data Source and Calculation Methodology Portfolio Modification
E3 Energy Price Forecast Methodology • “For the period after the available forward market prices, the method interpolates between the last available NYMEX market price and the long-run energy market price.” • “The long-run energy market price is used for the resource balance and all subsequent years.” • “The annual long-run energy market price is set so that the [combined cycle gas turbine] CCGT’s energy market revenues plus the capacity market payment equal the fixed and variable costs of the CCGT...” • “The long-run energy market price begins with the 2010 MRTU day-ahead market price escalated by the natural gas burner tip forecast. “ Portfolio Modification
E3 Hourly Load Shape Methodology • “…the annual energy avoided costs are converted to hourly values by multiplying the annual value by 8760 hourly market shapes.” • “…the hourly shape is derived from day-ahead LMPs at load-aggregation points in northern and southern California obtained from the California ISO’s MRTU OASIS.” • “…the hourly market prices are adjusted by the average daily gas price in California. The resulting hourly market heat rate curve is integrated into the avoided cost calculator, where, in combination with a monthly natural gas price forecast, it yields an hourly shape for wholesale market energy prices in California.” Portfolio Modification
Marginal Energy Cost (MEC) E3 2010 Price Ratios by Rate Period Relative to Summer Off-Peak Period Portfolio Modification Summer Off-Peak price = $42.85/MWh and Annual Average price = $49.49/MWh
Marginal Energy Cost (MEC) E3 2011 Updated Price Ratios by Rate Period Using Same Methodology Portfolio Modification Summer Off-Peak price = $42.30/MWh and Annual Average price = $49.49/MWh
E3 Hourly Price Shape Methodology • Start with PG&E’s DLAP Day-ahead LMP from CAISO • Divide by average of PG&E Citygate and Socal Border natural gas price from ICE. Calculate average using methodology from MPR model. • Before averaging PG&E Citygate and Socal Border prices, each is increased for a) gas distribution rate, b) municipal rate surcharge, c) gas transportation escalation rate, and c) gas hedging transaction cost. • The resulting hourly market heat rates are divided by the annual average market heat rate to generate an hourly price shape. Portfolio Modification
Marginal Energy Cost (MEC) For 2013 By Time of Use Rate Period and Voltage Level (¢/KWh) Portfolio Modification
T&D Loss Factors Energy Loss Factors Portfolio Modification Sources: Transmission Losses from May 14, 2010 "Transmission Loss Factors" Distribution losses from "Distribution Loss Values for the TO-8 Filing"
E3 Capacity Price Forecast Methodology Resource Balance Year • “…in the resource balance year and beyond, the value of capacity will equal the fixed cost of a new CT less the net revenues that the CT would attain from the selling to the real-time energy and ancillary service markets.” • “…prior to resource balance, the capacity value is interpolated from the resource adequacy value of $28.07/kW-yr in 2008 to the residual capacity value in the resource balance year.” For example, the 2014 value of $101.91/kW-yr is calculated with the formula: • $28.07 + (2014 – 2008) * ($138.83 - $28.07) / (2017 – 2008) • “E3 has set the resource balance year [of 2017] to reflect the recent Joint IOU July 1, 2011 filing in the LTPP proceeding (R.10-05-006 track 1)…” The 2017 value is $138.83/kW-year. Portfolio Modification
E3 Capacity Price Forecast Methodology Energy Market Net Revenues, a.k.a. Gross Margin or Net Energy Benefit • “In each hour that it operates, the unit earns the difference between the market price and its operating costs.” • “To determine the long-run value of capacity, the avoided cost model performs an hourly dispatch of a new CT to determine energy market net revenues. The CT’s net margin is calculated assuming that the unit dispatches at full capacity in each hour that the real-time price exceeds its operating cost (the sum of fuel costs and variable O&M) plus a bid adder of 10%.” • “The dispatch uses the 2010 MRTU real-time market shape (not the day-ahead market shape), and adjusts for temperature performance degradation using average monthly 9am – 10pm temperatures…” Portfolio Modification
Combustion Turbine Cost In E3 Avoided Cost Model (2009$) Portfolio Modification • Source: • E3 Avoided Cost Model, “CT Pro Forma" tab, cells J4:L12 and • California Energy Commission Staff 2009 Final Report: “Comparative Cost of California Central Station Electricity Generation Technologies” CEC-200-2009-017-SD • 2009 Market Price Referent resolution:E 4298
Residual Capacity Value In Resource Balance Year (2017$) Portfolio Modification Source: E3 Avoided Cost Model, "Market Dynamics" tab, cells K188:K194
Marginal Generation Capacity Cost (MGCC) Calculation of Levelized Cost over 2013-2018 ($/kW-year) Portfolio Modification Source: E3 Avoided Cost Model, "Market Dynamics" tab, columns G through L, row 199
Marginal Generation Capacity Cost (MGCC) Levelized For 2014-2019 By Voltage Level ($/KW-year) Portfolio Modification
T&D Loss Factors Demand Loss Factors Portfolio Modification Sources: Transmission Losses from May 14, 2010 "Transmission Loss Factors" Distribution losses from "Distribution Loss Values for the TO-8 Filing"
TOU Rate Periods and Voltage Levels • Summer is from May 1 through October 31 and Winter is from November 1 through April 30. The summer peak period is from noon to 6:00 p.m., Monday through Friday, except holidays; the summer partial-peak period is from 8:30 a.m. to noon and 6:00 p.m. to 9:30 p.m., Monday through Friday, except holidays; and, the summer off-peak period is 9:30 p.m. to 8:30 a.m., Monday through Friday, except holidays, and all day Saturday, Sunday and holidays. • The winter partial-peak period is from 8:30 am to 9:30 p.m., Monday through Friday, except holidays; and, the winter off-peak period is 9:30 p.m. to 8:30 a.m., Monday through Friday, except holidays, and all day Saturday, Sunday and holidays. • Holidays for rate making purposes are the legally observed dates for New Year’s Day, President’s Day, Memorial Day, Independence Day, Labor Day, Veterans Day, Thanksgiving Day and Christmas Day. • The three voltage levels are transmission (60 kilovolt (kV) and above); primary distribution (between 4 kV and 50 kV); and, secondary distribution (below 4 kV). Portfolio Modification