Download
1 / 95
950 likes | 1.15k Views
And the Survey Says…. Putting YOUR Healthy Youth Survey Results to Work. Spring 2003. Purpose: Help people understand & use their HYS reports. Welcoming picture drawn by a Healthy Youth. Welcome!. Introduction of presenters How many agencies are here today? Review Agenda

E N D
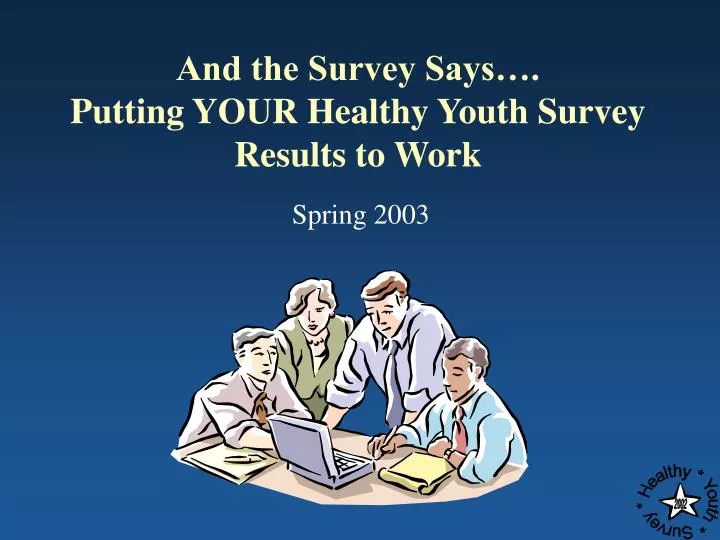
And the Survey Says….Putting YOUR Healthy Youth Survey Results to Work Spring 2003
Welcoming picture drawn by a Healthy Youth Welcome! • Introduction of presenters • How many agencies are here today? • Review Agenda • What we will have accomplished by the end of the day?
Ice Breaker • In small groups, each person shares • Name • Where you work • Share one interesting or obscure fact about yourself
Background of HYS 2002 History of WA survey efforts Content of HYS 2002 Sources of HYS 2002 items Data processing and quality control steps
Past Washington Surveys: Primary Content ‘88 ‘89 ‘90 ‘91 ‘92 ‘93 ‘94 ‘95 ‘96 ‘97 ‘98 ‘99 ‘00 ‘01 ‘02 Combination Health-risk Focused Risk & Protective Factor Focused
Joint Survey Planning Committee • Office of the Superintendent of Public Instruction • Division of Alcohol & Substance Abuse, DSHS • Department of Health • Office of Community Development • Governor’s Family Policy Council • RMC Research (survey contractor)
HYS 2002: Collaborative Effort of OSPI, DOH, DSHS, and CTED • Simple random sample of schools recruited at state level • County samples drawn as appropriate • Survey consistently administered in the Fall of even years • Survey given to 6th, 8th, 10th, and 12th graders • Survey booklets will have one-page tear-off answer sheet • Survey for 8th, 10th, and 12th graders will use 2 form “interleaved” administration
HYS 2002: Participation • The Healthy Youth Survey 2002 was completed… By 137,335 students… In 752 schools… In 203 school districts… In 39 counties.
Risk & Protective Factor DataConsistent with CTC/MTF SurveyDevelopment led by DASA/DSHS & OSPI • WSSAHB Questionnaire • Demographics • Alcohol, Tobacco, other drugs • School risk/protective factors • Community risk/protective factors • Peer-Individual-Family risk/ protective factors
Youth Health Behavior DataConsistent with National YRBS & YTSDevelopment led by DOH • YRBS Questionnaire • Demographics • Alcohol, Tobacco, Other drugs • Nutrition • Physical Activity • Safety Behaviors (Helmets, Seatbelts) • Mental Health/Depression/Suicide • Additional Tobacco Indicators
Getting the Best of Both Form A WSSAHB-like Form B YRBS-like Survey Core
6th Grade Survey One Form Survey Core + Mutually Agreed Items
Core Survey Items • Demographics • Alcohol, Tobacco and Other Drug Use Items • Key Violence-Related Items • School-Specific Asset Items • Depression
Sources of HYS 2002 Items • Monitoring the Future (MTF) • Youth Risk Behavior Survey (YRBS) • Communities that Care (CTC) • Youth Tobacco Survey (YTS) • PRIDE Survey
Data Processing and Quality Control • Administration procedures • Data cleaning procedures
Statistical Issues Validity and reliability Confidence intervals Comparing state and local results Generalizability
Validity and Reliability • Definitions • How we assure validity: Items from established instruments, validity checks • How we assure reliability: Standardized administration procedures
Confidence Intervals • What are they? • How to interpret the numbers • How to interpret the graphs • Practice activity (Ex. 1–2)
What is a Confidence Interval? • The reported value is probably a little different than the “true” value for all your students • We are “95% confident” that the “true” value is within the +/- range, called the “confidence interval”
Interpreting CIs Numerically Smoked cigarettes: 9.2% (± 1.1%) 9.2 – 1.1 = 8.1 9.2 + 1.1 = 10.3 Between 8.1% and 10.3% smoked cigarettes
Practice Activity • Exercises 1 and 2
Why Are Confidence Intervals Different Sizes? • Number of students • Inherent variability • Level of confidence (All 95% for HYS) • Sampling design
If the data are valid, why do we need confidence intervals? • Confidence intervals account for variability among students, NOT validity of the data • Variability is inherent in any population worth studying • Variability causes uncertainty in the results • “Doubt is not a pleasant condition, but certainty is absurd” – Voltaire
Comparing State and Local Results • Looking at differences numerically • Looking at differences graphically • Practice activity (Ex. 3–4)
Significant Differences: Numerically (Ex. 1) • Smoked cigarettes in the state: 9.2% (± 1.1%) Between 8.1% and 10.3% • Smoked cigarettes at my school: 14.1% (± 2.2%) Between 11.9% to 16.3% • Conclusion: Difference IS statistically significant
Significant Differences: Numerically (Ex. 2) • Smoked cigarettes in the state: 9.2% (± 1.1%) Between 8.1% and 10.3% • Smoked cigarettes at my school: 14.1% (± 9.6%) Between 4.5% to 23.7% • Conclusion: Difference is NOT statistically significant
Practice Activity • Exercises 3 and 4
Generalizability • What is generalizability? • To whom can we generalize results? • State & County sample • Non-sampled counties, districts, and ESDs • Schools • Why 70% participation is required
Quotations From Teachers Who Administered the Survey • About 25 students missed part of the session because of club photos • Absent students are taking a PSAT test • Many students had too much homework. Chose to do that rather than take the survey. • Seven students came too late to take the survey • The perfectionists, poor direction followers and slow readers could not finish
Challenges to Generalizability • Brainstorm challenges to generalizability • School level • ESD, County, or District level • How do these challenges affect data interpretation?
What if I don’t want to generalize? • Confidence intervals matter if you want to generalize to a larger population • You can describe the students surveyed, in that moment, without confidence intervals: • “Elmo Elementary School students who took the survey said…”
Final Note About Significance • Even if a difference is statistically significant, it might not be practically significant • Example • State alcohol use: 12.8 (±0.2) % • Local alcohol use: 14.4 (±1.2) % Statistically significant difference, but should it influence program planning?
Things to think about • Did the questions change? • Were the challenges to generalizability similar? • Is there a reason to think that things would have changed? (a prevention program)
Surveys over time • WSSAHB 2000 reports did not report confidence intervals – but the variability was still there! • Future HYS reports will have confidence intervals, so 2002 vs. 2004 comparisons will be easier
What should I know about comparing 2000 to 2002 data? • If you think you have comparable data, then: • If the 2000 percentage is INSIDE the 2002 confidence interval, then there is not a “statistically significant” difference • If the 2000 percentage is OUTSIDE the 2002 confidence interval, then you can’t be sure if the difference is “statistically significant” but the further away it is the more likely that a difference is significant • If you really, really need to know whether it’s significant, you can contact DOH for a specialized data run
What if I am in a small school, and we have huge confidence intervals? • Having a confidence interval protects you (and your program) from appearing to be ineffective when just a few students can make big changes • Consider the input of teachers & staff from small-school environments when interpreting data – the data should be used to complement what they already know about their kids
Local Report Overview Guide to the Local Report FAQ How to use your local report
Local Report Contents • Introduction and Overview • Key to the Notes • Highlights of the Local Results • Graphical summary of selected results • Selected results disaggregated by gender • Responses to all items
Guide to the Local Report, cont. Healthy Youth Survey 2002Survey Results Sample Middle School, Grade 8 The number of students who submitted survey forms Number of students surveyed: 64 Number of valid responses: 59 The impact of adolescent health risk behaviors remains a primary concern of citizens throughout the country. Many health problems experienced by adolescents are caused by a very few preventable behaviors….
Guide to the Local Report, cont. Healthy Youth Survey 2002Survey Results Sample Middle School, Grade 8 Number of students surveyed: 64 Number of valid responses: 59 The number of forms that were considered usable. The impact of adolescent health risk behaviors remains a primary concern of citizens throughout the country. Many health problems experienced by adolescents are caused by a very few preventable behaviors….
Guide to the Local Report, cont. To protect anonymity when data are broken down into identifiable groups.
Guide to the Local Report, cont. Number of students who responded to this item
Where Do Find Information About . . . ? • General Information (e.g. demographics) • Alcohol, Tobacco, and Other Drug Use • Other Health Concerns (e.g. health/safety) • School climate (e.g., bullying) • Quality of Life (e.g., student outlook) • Risk and Protective Factors: • Scale Results • Item Results