Download
1 / 47
470 likes | 670 Views
Going around the upper Arctic Ocean. Photo PSC/UW. Going around the upper Arctic Ocean. The Cold Halocline (and rivers) – Formation, retreat, advance Pacific circulation in the Arctic – measured by TS Getting Pacific Water off the shelf – Possible (and observed) mechanisms. Photo PSC/UW.

E N D
Going around the upper Arctic Ocean Photo PSC/UW
Going around the upper Arctic Ocean The Cold Halocline (and rivers) – Formation, retreat, advance Pacific circulation in the Arctic – measured by TS Getting Pacific Water off the shelf – Possible (and observed) mechanisms Photo PSC/UW
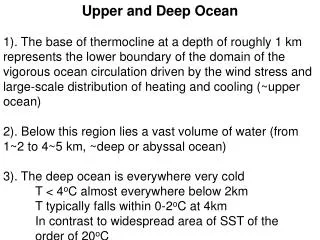
Typical Arctic profiles MIXED LAYER Usually thin (no wind stirring) PACIFIC WATER High nutrients Shallow (<200m) Tmax Comparatively fresh (<33psu) Mostly only in Western Arctic ATLANTIC WATER T>0ºC, deeper than 200m Tmax and layer below Higher Salinities Radionuclide tracers Eastern Arctic warmer Bottom Water “the rest” Western Arctic warmer
Atlantic water Surface Water How to form halocline water? - cannot form Halocline water simply by mixing (Aagaard, 1981) Adapted from Steele and Boyd, 1998
ADD COLD, SALTY Temp Salty ADD COLD, FRESH Convect Halocline formation Temp Fresh Salty Aagaard et al, 1981 ~ 50m ~ 100m Rudels et al, 1996 ~ 50m ~ 100m
ADD COLD, SALTY Temp Salty ADD COLD, FRESH Convect ADVECTIVE HC Temp Fresh Salty Aagaard et al, 1981 ~ 50m ~ 100m CONVECTIVE HC Rudels et al, 1996 ~ 50m ~ 100m Steele and Boyd, 1998 – source of halocline water differs (advective or convective) Woodgate et al, 2001 – temperature of halocline water differs (convective must be at freezing temperature, advective may or may not be at freezing)
Halocline formation Convective Advective Woodgate etal, 2001
Basin/Shelf FSBW/BSBW origin Black= FSBW Blue = BSBW Red = AW Green = Rivers Orange = Pacific inflow .. but what about change?? Rudels et al, 2004, Polar Research
Retreat of the Cold Halocline (Steele and Boyd, 1998) In 1995, only Makarov has a cold halocline Use salinity in 40-60m band as an indicator Hi S = NO CHL Lo S = CHL
Injection point of freshwater (Russian Rivers) has changed Backed up by chemical data, Ekwurzel et al., 2001 Guay et al., 2001 Retreat of the Cold Halocline (Steele and Boyd, 1998) PREVIOUS – RW into Eurasian Basin – CHL in Eurasian Basin 1995 – RW along shelf instead – no CHL in Eurasian Basin
Decadal averages of Russian Data 1950s to 1980s http://nsidc.org/data/g01961.html (see also Swift et al, 2005 annual averages in boxes 1948-1993 - ftp:://odf.ucsd.edu/pub/jswift/arctic_aari_method_B
“Levitus” for the Arctic http://psc.apl,washington.edu/Climatology.html
The (partial) return of the Cold Halocline(Boyd et al, 2002) Consider (upper 80m) S over Lomo Ridge - 1995 ~ 34 psu – no CHL - 1997 ~ 33.55 psu - 1999 ~ 33 psu - 2000 ~ 33.3 psu – CHL returning What could be causing this?? So far, this is EASTERN Arctic story, what about the Western Arctic
WESTERN ARCTIC (PACIFIC) HALOCLINE - greater salinity range - fresher at surface - general Tmax above Tmin - very varied - (rich in nutrients) Western versus Eastern Arctic Halocline BSW – Bering Sea Water UHW – Upper Halocline Water LHW – Lower Halocline Water AW – Atlantic Water DW – Deep Water Adapted from Steele and Boyd 1998 EASTERN ARCTIC (ATLANTIC) HALOCLINE - less salinity range - saltier at surface - sharper bend in TS space
Western versus Eastern Arctic Halocline Arctic Intermediate Water Atlantic Water Image from Steele and Boyd 1998 Polar Water Arctic Surface Water BSW – Bering Sea Water UHW – Upper Halocline Water LHW – Lower Halocline Water AW – Atlantic Water DW – Deep Water European Speak: e.g. Manley et al, 1992 Polar Water T: < 0 deg C and S: <34.4 psu Arctic Surface Water T: < 0 deg C and S: 34.4-34.9 psu Atlantic Intermediate Water T: 0-3 deg C and S: 34.4-34.9 psu Atlantic Water T: > 3 deg C and S: > 34.9 psu
JGR, 1996 JGR, 2005 Shift of Pacific/Atlantic Front Historic Russian Data - silicate profiles in central Makarov - Si max disappears in late 1980s - use TS and chemistry to show Pacific Atlantic Front retreated from Lomo Ridge to Mendeleev Ridge by 1993
Bering Strait and the Chukchi Sea WARMER FRESHER LOWER IN NUTRIENTS COLDER SALTIER RICHER IN NUTRIENTS Nutrient-rich Anadyr waters Bering Shelf waters Alaskan Coastal Current (warm, fresh, seasonal) Siberian Coastal Current (cold, fresh, seasonal) Stagnation Zones over Herald and Hanna Shoals To first order, except for - cooling - input from coastal polynyas, Chukchi dominated by input through Bering Strait Export to Arctic ~ Input through Bering Strait Woodgate et al, DSR, 2005, http://psc.apl.washington.edu/Chukchi.html
JGR, 2004 ACW=Alaskan Coastal Water sBSW = summer Bering Sea Water
Generic Pacific Water circulation Steele et al, 2004 - change in pathway with change in Atmospheric state - shift of Pacific/Atlantic boundary from Lomonosov Ridge BUT - doesn’t always match Fram Strait outflow – is there a better tracer - how get the Pacific Water off from the Chukchi
Bering Strait and the Chukchi Sea WARMER FRESHER LOWER IN NUTRIENTS COLDER SALTIER RICHER IN NUTRIENTS Nutrient-rich Anadyr waters Bering Shelf waters Alaskan Coastal Current (warm, fresh, seasonal) Siberian Coastal Current (cold, fresh, seasonal) Stagnation Zones over Herald and Hanna Shoals To first order, except for - cooling - input from coastal polynyas, Chukchi dominated by input through Bering Strait Export to Arctic ~ Input through Bering Strait Woodgate et al, DSR, 2005, http://psc.apl.washington.edu/Chukchi.html
Getting water off the shelves Topographic constraints (Conservation of Potential Vorticity)
Long Strait Chukchi Sea Outflow = TOPOGRAPHIC CONSTRAINTS (Potential Vorticity Conservation) - Taylor columns in Chukchi - flow ~ along isobaths eastward BUT WE SEE PW GETS AWAY FROM TOPOGRAPHY = FRICTION (TOP or BOTTOM) = DENSITY DIFFERENCES - dense water outflows = WIND EFFECTS - upwelling and downwelling - undercurrents = EDDIES = INERTIAL and TIDAL OSCILLATIONS AND MIXING =Four main outflows 1. Barrow Canyon 2. Central Gap 3. Herald Canyon 4. Long Strait?? = Most nutrients in West = Outflows move east & north = Seasonal & interannual variability in TS (thus density and equilibrium depth) and also in volume
X Ice Wind S flux as new ice Dense water on shelf Dense water flows down shelf as a descending plume, entraining water. (i.e. down, but not OUT) Dense Water Outflow– e.g. from coastal polynyas(e.g. Martin et al, 2004) ICE Temperature ICE Thickness
2002, JGR ~0.06Sv - can get the salinities, but volume is small
Upwelling of deeper water - can come up canyon onto the shelf - cf Chukchi slope canyons, Barrow Canyon, and many others If initial stratification enough, can get undercurrent opposite to the wind (Yoshida Undercurrent) - cf Beaufort slope Wind effects X X Wind Wind isopycnal
Results of a strong westward wind 3rd October 5th October Ship’s ADCP of the Beaufort slope current system (red= towards you) (Andreas Muncheow, UDel)
Note Atmospheric Scales - storms in the Gulf drive effects on the North Shore (Pickart, pers.com.)
Chukchi Slope 2002-2003TS-properties Temperature Maximum is December – March, i.e. advective from the south Intrusions of Atlantic Water in Autumn 73 20N - red 60m/70m water 73 37N - cyan 60m/110m water - navy 100m/110m water
- 3 short-term moorings across the boundary current - CTD sections with oxygen, nutrients, CFCs, O-18 and Barium CBL2002ExpeditionAugust-September 2002http://psc.apl.washington.edu/CBL.html USCGC Polar Star Hydrographic survey of the Mendeleev and Chukchi Borderland Region
Upwelling versus polynyas?? Use Silicate to track Pacific Water in the Chukchi Borderland
NO ... salinities are only near 34 psu in extreme winters, and then the waters are at freezing, not warmer Bering Strait TS 1990-1991 Woodgate et al, 2005 Can we get this TS from Bering Strait??
Along the Chukchi Shelf, upwelling and diapycnal mixing of lower halocline waters and Pacific waters (Note ventilation by polynya waters couldn’t give this T-S structure) (Woodgate et al, 2005) Woodgate et al, 2005, GRL Influence of shelf waters??
Do the volumes work out? Volume PW at 33.1 psu per year ~ 6x 10^12 m3/yr (0.6 Sv for 4 months) In Arctic ~ half pure, half mixed with AW (1:1) Thus need 3 x 10^12 m3/yr AW to be raised onto shelf Observed upwelling events in Barrow Canyon = 2-3 x 10^11 m3 per event Therefore need 10 events and there are multiple wind events, and multiple canyons So – plausible Also, this ventilation rate is an order of magnitude higher than estimates of polynya water formation Woodgate et al, 2005, GRL
halocline depth Arctic Rossby Radius Eddies in the Beaufort Seae.g.,Hunkins and Manley, Plueddemann and MANY others http://www.whoi.edu/science/PO/arcticgroup/projects/eddies.html Predominantly Anticyclonic
Eddy Census 1 eddy = (10 km radius, 50m) ~ 2 x 10¹⁰ m3 Flux through Bering Strait ~ 1 Sv ~ 3 x 10¹³ m3 per yr If all eddies, makes ~1000 eddies a year. Do we see 1000 eddies??? - no - XBT lines
LM2 LM3 LM1 Eddies in the non-BeaufortArctic TWO EDDY TYPES Cold (Tf), Fresh, near surface, AC, - likely from shelf polynyas Warm, Salty, ~ 1000m deep, AC - instabilities on upstream front (e.g. St Anna) 40 cm/s; ~ 10km radius, but volume flux ~ 0.1 Sv or less
NPEO SWYD Pacific Water AW PW DISSOLVED OXYGEN - High at surface (ventilated from atmosphere) - Low = OLD water (long time since at surface) or = Evidence of high biological activity THUS – Pacific Water has LOW Dissolved Oxygen PW - Low Oxygen Falkner et al, 2005 DSR
Redfield-Ketchum-Richards Model (Redfield et al, 1963) (CH20)106(NH)16(H3PO4) + 138 O2 = 106 CO2 + 122 H2O + 16 HNO3 + H3PO4 Biogenic matter + oxygen = Carbon Dioxide + Water + NUTRIENTS Fixing of nutrients and Carbon to make biogenic matter Decay of biogenic matter using up Oxygen, forming nutrients SILICATE, NITRATE, PHOSPHATE - High from source in Pacific BUT – not conservative PW - Hi Nutrients Try to create a “tracer” that is conservative “Quasi-conservative Tracer” “NO” and “PO” – Broecker, 1974 - cope with growth and decay NO = 9 NO3 + O2 PO = 135 PO4 + O2 N:P ratios NO:PO ratios N* (N star) – Gruber and Sarmiento, 1997 - indicates nitrogen fixation and denitrification N* = 0.87 [N – 16 P + 2.9 µmol kg-1]
AW PW % PW in upper 30m NITRATE:PHOSPHATE RELATIONSHIP different in AW and PW PW versus AW in N:P space = For a Nitrate value, PW have more Phosphate = Slope set by Redfield = Exact lines may change NO3(pw) = 14.828 x PO4(pw) – 12.16 (Falck, 2001) BUT work out % influence of PW and AW (..but certainly no better than 10% .... assumes ice melt, P and runoff same as AW .... denitrification .. and other such processes) Jones, Anderson and Swift, GRL, 1998 Distribution of Atlantic and Pacific waters in the upper Arctic Ocean: Implications for circulation
Rudels et al,1996 HALOCLINE BASICS Formation possibilities Western versus Eastern Arctic Different branches of PW CIRCULATION CHANGES Shift in rivers outflow Retreat and recovery of CHL Shift of Pacific/Atlantic Front Upper Arctic Ocean Circulation and Ventilation MECHANISMS OF SHELF-BASIN EXCHANGE Winddriven upwelling and mixing of AW with PW Potential vorticity conservation, following topography Dense water outflow from polynyas Eddies (AC, ~ scale of Rossby radius) Winddriven undercurrents (Yoshida jet) Tides and inertial oscillations TRACING PW versus AW HALOCLINE PW lower salinity, smoother TS PW lower dissolved oxygen PW higher nutrients (esp Silicate) AW/PW NO3:PO4 ratio Photo PSC/UW
Things not to forget • Tidesdown slope flow • thermobaricity • why are nutrients hi in Sea ice • is EPS doc or dic • - ice algae distribution?? new/old ice/ water type from which ice forms?? • Alkalinity • stats warnings .. 95% confidence =
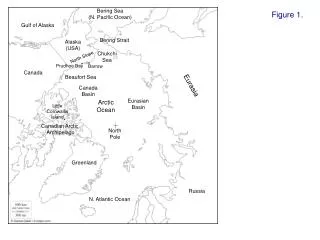
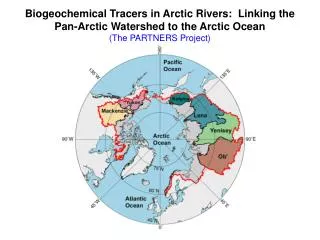
Routes in the Arctic Adapted from Jones et al., 2001, Polar Research