Download
1 / 20
200 likes | 344 Views
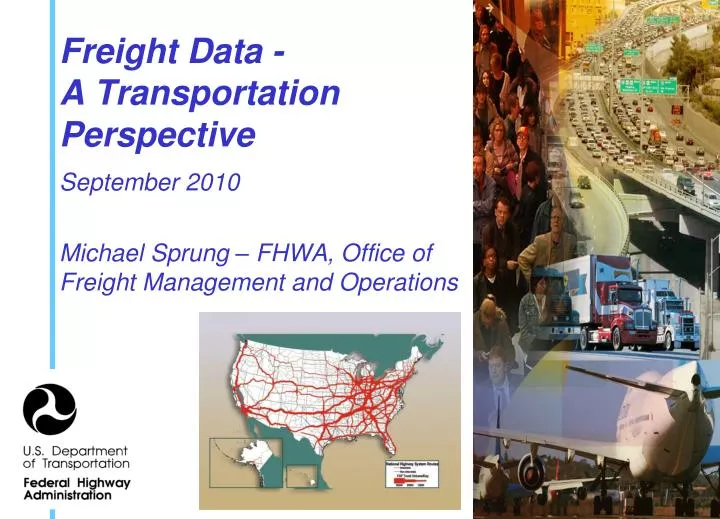
Freight Data - A Transportation Perspective September 2010 Michael Sprung – FHWA, Office of Freight Management and Operations. Truck Transportation (NAICS 484) – Est. Revenue for Employer Firms: 2008. To inform policy and investment, we need to understand.

E N D
Freight Data -A Transportation PerspectiveSeptember 2010Michael Sprung – FHWA, Office of Freight Management and Operations
Truck Transportation (NAICS 484) – Est. Revenue for Employer Firms: 2008
To inform policy and investment,we need to understand • How does freight movement affect congestion, infrastructure wear, freight carriers, safety, and the environment? • How does congestion, expected and unexpected delay, and cost affect freight movement? • How does the economy adjust in productivity, shifting activity among regions, and global competitiveness? • How will policies and investments affect freight movement and its consequences?
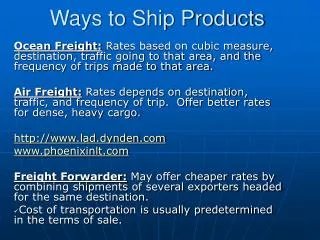
An Understanding of Freight Transportation • How much& what freight moves from place to place? • Weight • Value • Commodity • Where & how is freight moving? • Origin & destination • Route used • Mode of transportation • When is freight carried? • Season • Time of day
FHWA Freight Transportation Data • Freight Analysis Framework (FAF): • A database of regional freight flows by tons and value for all modes, with 30-year forecasts, and annual provisional updates • An assignment of average number of trucks to individual highway segments on the national network • Freight Performance Measures (FPM) Program • 500,000 + trucks and trailers • Travel time and travel time reliability for 25 Interstate Highways • Crossing time and crossing time reliability at major border crossings
FAF3 Details • Value & weight for all domestic, export, & import shipments • 7 Domestic modes (truck, rail, water, air, multiple modes & mail, pipeline, and other & unknown) • 7 Foreign modes (same as domestic modes) • 123 Domestic regions • 8 International regions (Canada, Mexico, & 6 groupings of countries based on UN definitions) • 43 Commodity classes (2-digit SCTG codes)
Canada Eastern Asia Europe South, Central Africa & Western Asia South-Eastern Asia Rest of Mexico And Oceana Americas FAF3 Regions
International Trade as a Share of Tons and Value by Domestic Mode
Major FAF3 Data Sources • Commodity Flow Survey (CFS) • TransBorder Freight Data • Foreign Trade Statistics • Waterborne Commerce Statistics • Port Import/Export Reporting Service (PIERS) • Vehicle Inventory and Use Survey • Highway Performance Monitoring System • National Transportation Atlas Database • Transportation Satellite Accounts
Data Gaps • Domestic-leg of international trade flows • True origin of exports • True destination of imports • Transshipments • Trade between two foreign countries using the U.S. transportation system (ports, highways, borders, etc.) • Some progress made in this area with Canadian and Mexican transshipments from foreign trade data.
FAF Summary • FAF provides a comprehensive national picture of freight flows and baseline forecasts to support policy studies • FAF shows states and regions who their major trading partners are with the volumes and sources of through traffic at a corridor level • Local specific analysis requires supplemental data collection to provide local detail
Freight Performance Measures Program • Approximately 500,000 probe vehicles • 340,000,000 truck positions (e.g. telemetry points) monthly • over 4,000,000,000 positions annually • Partnership between FHWA and ATRI with a cooperative data governance model • FHWA sets general contractual guidelines on key business areas and management decisions it intends to use the data for • Congestion and Bottleneck Identification • Understanding Freight System Performance • FHWA and ATRI monitor requests for data and determine cooperatively who should have access to data and at what level of aggregation
Measuring Border Crossing Delay Trip origin A Diversion option to alternate crossing B Final approach to border crossing (beyond the end of queue) C End of queue D Stop bar E Arrival at primary inspection F Exit primary inspection G Exit secondary inspection H I Trip Destination Canada U.S. Border
‘Ideally’ Data Would Be: • Timely • Accurate • Relevant • Complete • Obtainable • Clear • Consistent • Harmonized • Affordable
Freight Data Challenges • Definitions of freight transportation terms are not always harmonized: • Commodity Classifications • Mode Definitions • ‘Available data’ must often be used as a proxy for ‘Needed data’ • Trade (flow of $) used in lieu of international freight flows • Value-to-weight ratios used where $ or tonnage data are incomplete • Lack of authoritative data sources and management agencies • Issues with comparability and quality when data must be sought from many different transportation and trade data collection efforts
We rely on customer feedback • Do the estimates we publish align with other sources you use? • What would make existing freight data resources more usable? • What are the major freight issues you and your partners are trying to address?
Thank You! DOT Freight Website: http://www.freight.dot.gov/ Without Data It’s Just An Opinion.