Download
1 / 19
190 likes | 209 Views
Learn about the process of generating time domain strain data (h(t)) for the ALLEGRO resonant detector calibration. Topics include signal flow diagram, transfer function equations, calibration measurements, noise curves, and stability.

E N D
Generating time domain strain data (h(t)) for the ALLEGRO resonant detectororcalibration of ALLEGRO data Martin McHugh Loyola University New Orleans on behalf of the ALLEGRO group http://sam.phys.lsu.edu/ GWDAW-9, Annecy 16 December , 2004
Outline • Motivation • Signal flow diagram, transfer function equations • Discussion of calibration measurements • Noise curves, stability • future GWDAW-9, Annecy 16 December , 2004
Motivation • LSC stochastic background analysis using S2 data from ALLEGRO and LIGO Livingston (see John Whelan’s talk later today) • Unlike an event list based search, a coherent search such as this requires a phase consistent response function for the detector signal path GWDAW-9, Annecy 16 December , 2004
ALLEGRO schematic GWDAW-9, Annecy 16 December , 2004
Signal path GWDAW-9, Annecy 16 December , 2004
Form of each Transfer Function GWDAW-9, Annecy 16 December , 2004
Need to determine -- So in practice the calibration amounts to -- • Mode frequencies and Q’s -- fm , fp , Qm , Qp • overall scale -- in practice we measure • is mechanical gain -- includes ‘tuning factor’ • Lock-in amplifier parameters -- gain, filter delay and phase shift • Also need to know the phase of the lock-in reference oscillator Inverse fft then gives complex heterodyned strain time series GWDAW-9, Annecy 16 December , 2004
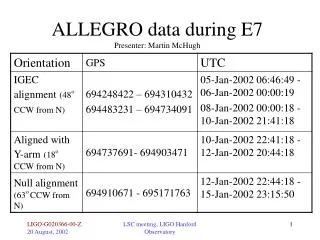
transducer current changed temperature fluctuations S2 data -- 2003 GWDAW-9, Annecy 16 December , 2004
New calibrator • One plate of capacitor is tightly coupled to bar. • Other plate is weakly coupled to the bar, so acts like a free mass. • Both plates electrically isolated. GWDAW-9, Annecy 16 December , 2004
The calibrator mounted on the bar GWDAW-9, Annecy 16 December , 2004
Transfer function - white noise excitation to measured output measurements from 20 March 2004 -- excitation measured through lock-in and A/D plotted here we have gives us the overall scale - GWDAW-9, Annecy 16 December , 2004
GWDAW-9, Annecy 16 December , 2004
Lock-in measurements Band-limited white noise injection -- recorded directly and through lock-in/anti-aliasing filters GWDAW-9, Annecy 16 December , 2004
Compare fourier coefficients Lock-in/filter introduces an 11ms delay and 18 degree phase shift GWDAW-9, Annecy 16 December , 2004
GWDAW-9, Annecy 16 December , 2004
Calibration line Detector resonances Extra mechanical resonances GWDAW-9, Annecy 16 December , 2004
Calibrated strain spectrum from S2 GWDAW-9, Annecy 16 December , 2004
Stability of calibration GWDAW-9, Annecy 16 December , 2004
Summary, future • We have calibrated h(t) for S2 data set at level • Currently stored in Matlab files, plan to put these data into frames • detector much more stable now, should continue through S4 • will determine overall sign • hardware injections are planned GWDAW-9, Annecy 16 December , 2004