Download
1 / 9
90 likes | 254 Views
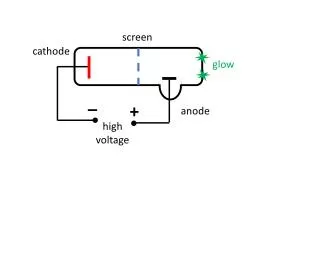
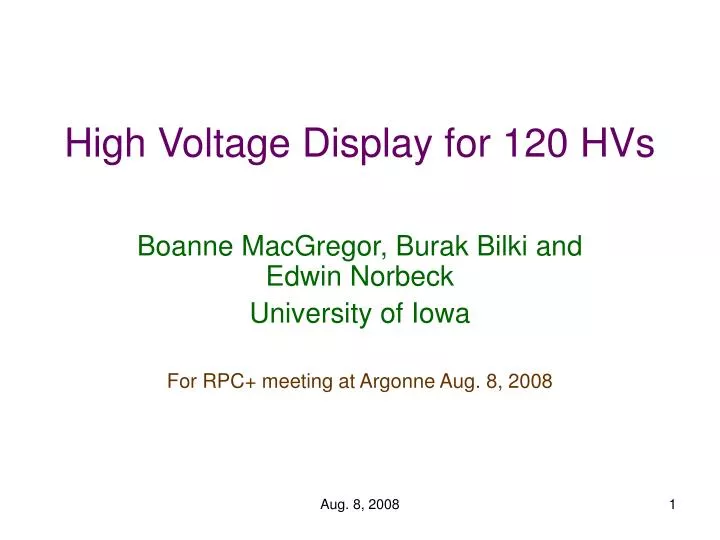
High Voltage Display for 120 HVs. Boanne MacGregor, Burak Bilki and Edwin Norbeck University of Iowa For RPC+ meeting at Argonne Aug. 8, 2008. Goals.

E N D
High Voltage Display for 120 HVs Boanne MacGregor, Burak Bilki and Edwin Norbeck University of Iowa For RPC+ meeting at Argonne Aug. 8, 2008 Aug. 8, 2008
Goals The object is to display all 120 voltage settings and actual delivered voltages so that they can be seen at a glance, even from across the room. This display is designed specifically for the cubic meter digital calorimeter with 40 planes of 3 detectors each. Aug. 8, 2008
How to Read the Graph The data is in a bar graph. The top of each bar is the set voltage. The bottom is the actual voltage. Each plane is a group of three bars. Blue, red, and green bars correspond to the first, second, and third detectors in that plane. The planes are grouped in fives for easy viewing. A 30 V offset is added to the set voltage so that there is something to see when the two quantities are the same. Aug. 8, 2008
If every channel has output voltage equal to the set voltage of, say, 7 kilovolts, the graph will display the following: A casual observer would spot any irregularity. Aug. 8, 2008
If power fails and every channel’s output voltage drops to zero, the graph will display: The dramatic change should get the watcher’s attention: no close scrutiny or advanced training required. Aug. 8, 2008
Here only a few channels’ outputs deviate from the set voltage. Aug. 8, 2008
Note how each unusual reading stands out. Considering that there are 120 different bars, it’s surprisingly easy to identify an individual channel. For instance, if a red bar in the third section reaches all the way down the page, then voltage has dropped in the second detector in a plane numbered between 11 and 15. Aug. 8, 2008
Improvements in the Works We plan to add a second, smaller graph to display the current in each channel. Since current in µA is an integer below 5, this graph can be placed below the voltage graph without taking up much vertical space. The third demo graph shows a break in the y-axis scale so as to display only voltages between 0-100 V and 5.5-7.0 kV. Aug. 8, 2008
The voltage display and control will use a dedicated PC An old computer should be more than adequate. Neither high speed or large memory is needed. The program will toggle between the display mode and the voltage control mode, a program written by B. Bilki. A list of the information from the Lecroys will be made available to the data acquisition computer. Aug. 8, 2008