Download
1 / 17
170 likes | 288 Views
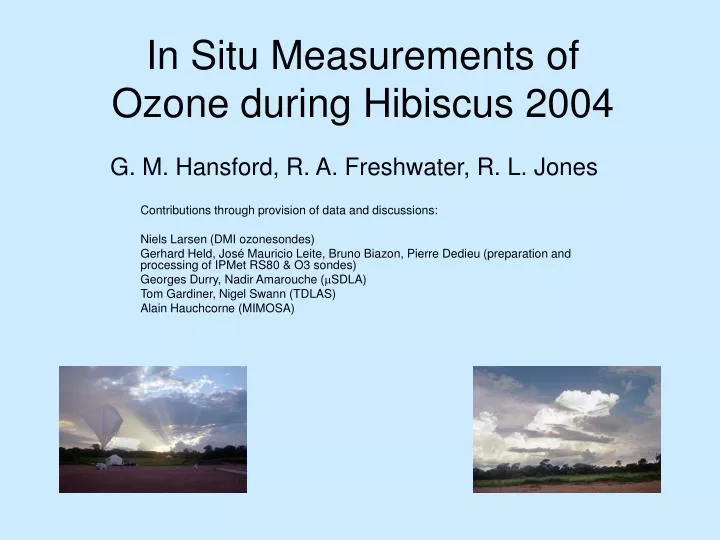
In Situ Measurements of Ozone during Hibiscus 2004. G. M. Hansford, R. A. Freshwater, R. L. Jones. Contributions through provision of data and discussions: Niels Larsen (DMI ozonesondes)

E N D
In Situ Measurements of Ozone during Hibiscus 2004 G. M. Hansford, R. A. Freshwater, R. L. Jones Contributions through provision of data and discussions: Niels Larsen (DMI ozonesondes) Gerhard Held, José Mauricio Leite, Bruno Biazon, Pierre Dedieu (preparation and processing of IPMet RS80 & O3 sondes) Georges Durry, Nadir Amarouche (mSDLA) Tom Gardiner, Nigel Swann (TDLAS) Alain Hauchcorne (MIMOSA)
Outline • Assessment of 13 Ozonesondes (DMI/IPMet) launched during Hibiscus • TTL characteristics: temperature, lapse rate, saturated water vapour mixing ratio profiles and their relation to ozone • Definition of the TTL appropriate to Bauru • Individual flights: anomalies, relation to PV • Assessment of UCAM solid-state ozone sensor measurements on SF flights • Correlations with other tracers: CH4, H2O, CO2 • Comparison with Theseo 2000 correlations
All Ozonesondes launched during Hibiscus • Flat mixing ratio in the troposphere • 11th Feb and 6th Mar are anomalous in the altitude range 12 – 16 km
11th Feb 6th Mar 16th Feb MIMOSA PV Maps at 350K: Selected Dates • 350K corresponds to ~13.6 km, 165 hPa • 11th Feb and 6th Mar show high PV at this level • other dates show normal PV characteristic of the tropics
Ozonesondes: Averages and Ambient Temperature • Ozonopause in the average profile occurs at 13.66 km • Except for the boundary layer, the TTL shows greatest variability • Standard deviation is only ~5% above 20 km • Broad temperature minimum in individual and average profiles • Cold-point tropopause at 17.56 km (-75.9ºC) in the average profile • Variability also greatest in the TTL, though less pronounced than ozone
Ozonesondes: Lapse Rate and Saturated Water Vapour MR • Clear TTL signature 13.4 – 17.8 km • Local minimum in the average lapse rate at 13.42 km • Lapse rate profiles very noisy • Very flat SWVMR between 15.0 – 17.8 km • Minimum in the average profile is 12.2 ppmv • Individual minima are more important? Dataset minimum is 6.0 ppmv on the 20th Feb
The TTL above Bauru Lower boundary Lapse rate minimum 13.42 km Ozone minimum 13.66 km Upper boundary Cold-point 17.56 km BUT, a secondary local minimum (within 3ºC) is frequently found in the range 18 – 19 km TTL Statistics from Ozonesonde Series • Definitions of the TTL • Highwood and Hoskins (1998): extending from the main convective outflow to the cold point. • Sherwood and Dessler (2001): the region where convection overshoots its level of neutral buoyancy. • Vömel et al. (2002): TTL lower boundary can be defined by a local minimum in relative humidity. • Thuburn and Craig (2002): region where radiation is more important than convection, but convection is more important than chemical ozone production. • Gettelman and Forster (2002): lower boundary marked by the lapse rate minimum, upper boundary by the cold point.
Individual Profile: 16th February 2004 • TTL extends from 14.2 – 19.2 km (lapse rate minimum to secondary temperature minimum) • Cold-point at 16.4 km • Although a clear lapse rate minimum is apparent in this dataset, many show multiple local minima in the range 10 – 15 km Conclusion The Gettelman and Forster criteria for the TTL boundaries are not appropriate for this region of the tropics. TTL definition appropriate for Bauru? – Lower boundary: change in gradient in ozone mixing ratio. Upper boundary: decrease in ozone variability. 14.0 – 17.9 km This definition reflects the potentially greater role of horizontal transport/mixing at TTL altitudes relative to sites closer to the equator.
SF4 24th Feb 2004: O3 (O3-SSS), CH4, CO2 (mSDLA) Ascent Profiles • No clear correlations between any of these tracers
SF4 24th Feb 2004: O3 (O3-SSS), H2O (mSDLA) Descent Profiles • Anti-correlation between ozone and water vapour 16.5 – 19 km • Major features occur at similar altitudes
SF2 13th Feb 2004: O3 (O3-SSS), CH4 (mSDLA) Ascent Profiles • No significant correlations over any extended altitude range
SF2 13th Feb 2004: O3 (O3-SSS), H2O (mSDLA) Descent Profiles • No significant correlations over any extended altitude range (large feature at 6 km correlated?)
SF3 26th Feb 2004: O3 (O3-SSS), H2O (TDLAS) • Anti-correlation during descent between 10.5 and 13.5 km • No other significant correlations
9th Feb 2000: Outside Vortex 27th Feb 2000: Inside Vortex THESEO-2000: O3 (O3-SSS), CH4 (TDLAS) • Much more obvious (anti-)correlations seen between ozone and methane above Kiruna • But, these profiles represent mostly stratospheric air
Summary of Tracer Correlations on SF Flights • These results need to be interpreted in terms of origin of air – are any (anti-)correlations expected?
Future Work Ozonesondes • Calculate photochemical ozone production rates in the lower TTL, and check for a positive correlation between ozone and lapse rate above ~14 km (Folkins et al, 1999) • Check ancillary data for 11th Feb and 6th Mar to understand elevated ozone in the 12 - 16 km range on these dates SF flights • Interpretation of (lack of) correlations between ozone and other tracers • Comparison with back-trajectories
Folkins et al, 1999 Folkins, JAS, 2001